
The first speculative tragedy of global proportions, the Panic of 1857, erupted in the U.S. before being felt in the U.K. Mirroring the Panic of 1837 albeit on a lesser scale, the episode in the U.S. was accentuated by a colossal increase in public land sales. The expanded geographical scope of the affair was a direct result of the Crimean War (1853–56), which severed Europe from the world’s largest wheat exporter, Russia, while simultaneously swelling demand for the same commodity. In a repeated sequence, fund flows were stimulated by gold discoveries in North America, which ensured that proceeds from land sales were in the form of specie that, in turn, could be utilized by banks as a reserve base for an expansion of credit.[1] In keeping with the prior episode, the outsized proceeds were not only allowed to accumulate at “a fearful rate” in the subtreasuries, where the National Monetary Commission later determined the funds were responsible for “furnishing the fuel” of speculation, but also used to rapidly reduce the Federal Debt, which was lowered by 58% (from $68.3 million) to $28.7 million between 1851 and 1857, freeing up capital for other purposes.[2]
With the Mexican-American War (1846–48) culminating in a vast expansion in U.S. territory, speculation was initially focused on U.S. railroads, which tripled the size of their combined network from 5,996 miles in 1848 to 24,503 miles in 1857.[3] Per Figure 1, the U.S. railroad index gained 37.5% during the 35 months ending December 1852. However, the same index of U.S. railroad stocks declined thereafter, falling 38.2% in the 3 years ending December 1855. Occurring amidst an economic expansion, the contraction in prices dovetailed with a resurgence in the new issues market. This included a step-up in the sale of public lands (per Figure 2) that jumped from $1.4 million in 1852 to $5 million in 1853 before reaching $11.5 million in 1854 and $11.3 million in 1855. Taken with grants to railroads, a stunning 39.7 million acres, an area equal to nearly a third of France, fell into private hands in 1856 alone.[4] Further, the volume of corporate securities rose materially. Following a survey in June 1853, the U.S. Treasury reported that railroads had outstanding $480 million of publicly-traded securities, including $310 million in stocks and $170 million in bonds, which accounted for, respectively, 48.3% of the $642 million of outstanding stocks and 87.4% of the $195 million of outstanding bonds.[5] At that time foreign investors held 23.7% of total U.S. bonds, against just 2.6% of corporate stocks. By 1857, Hunt’s reckoned that an estimated 200,000 holders held $850 million or railroad securities, of which $450 million was attributed to stocks and $400 million to bonds.[6]
Figure 1. U.S. Stock Prices, 1850–59
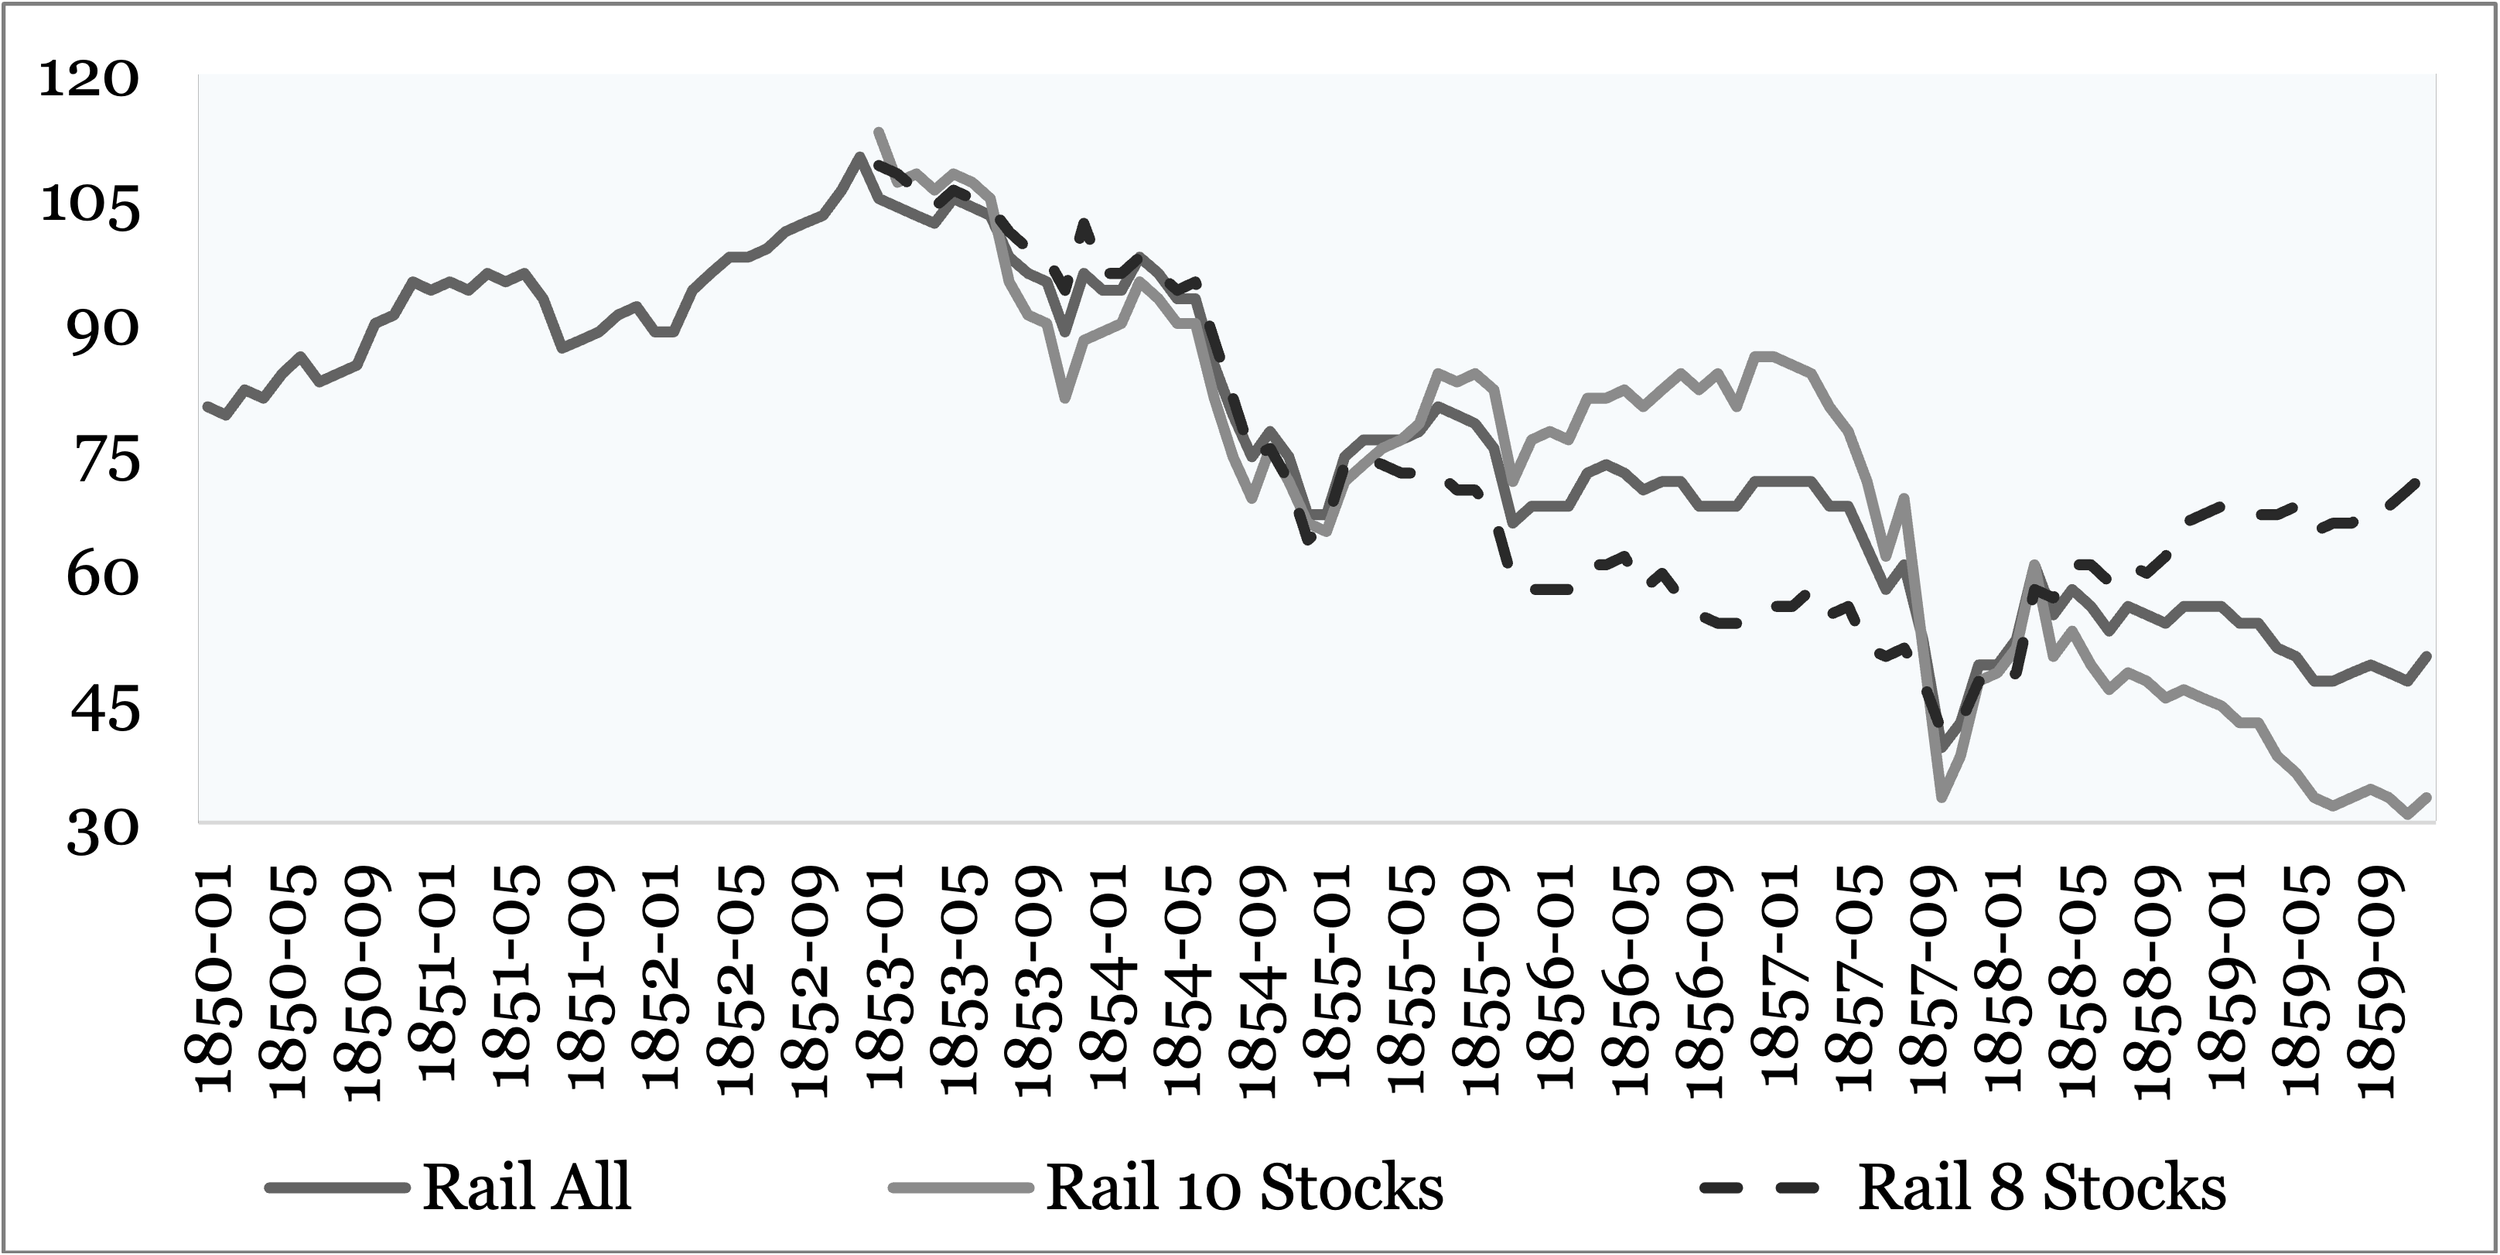
Source: Smith & Cole (1935). Rail All is the all-railroad index. Index of 8 includes the (i) Boston & Providence, (ii) Boston & Lowell, (iii) Eastern of Massachusetts, (iv) Philadelphia, Wilmington & Baltimore, (v) Hudson River, (vi) Panama, (vii) Camden & Amboy, and (viii) New York and Harlem. Index of 10 includes (i) Baltimore & Ohio, (ii) Philadelphia & Reading, (iii) Michigan Central, (iv) New York Central, (v) Illinois Central, (vi) Cleveland & Toledo, (vii) Chicago & Rock Island, (viii) Chicago, Burlington & Quincy, (ix) New York & Erie, and (x) Michigan Southern.
While the particulars are unclear, statements from underwriters indicate that congestion was present in the new issues market as early as November 1852, when George Peabody, the leading underwriter of American railroad securities, warned that municipal and rail issues had proceeded “to an unjustifiable and alarming extent,” and accounts from Baring Brothers & Co. had already reported “a mass” of railroad bonds that “no longer found takers.”[7] With the latter lamenting in the next month that the oversupply of corporate securities “forbid any hope of gain,” because “when one was taken up, others were forced on the market,” one can infer that the demand for railroad offerings peaked in unison with the index of railroad stocks in December 1852, more than 4 years before the panic.[8] Consequently, it can be assumed that the wholesaling risk among investment banks was not only sizable, but also growing in the run-up to the panic in a manner not unlike what was observed 2 decades earlier.
Figure 2. U.S. Land Sales vs. U.S. Railroad Stock Prices, 1850–59
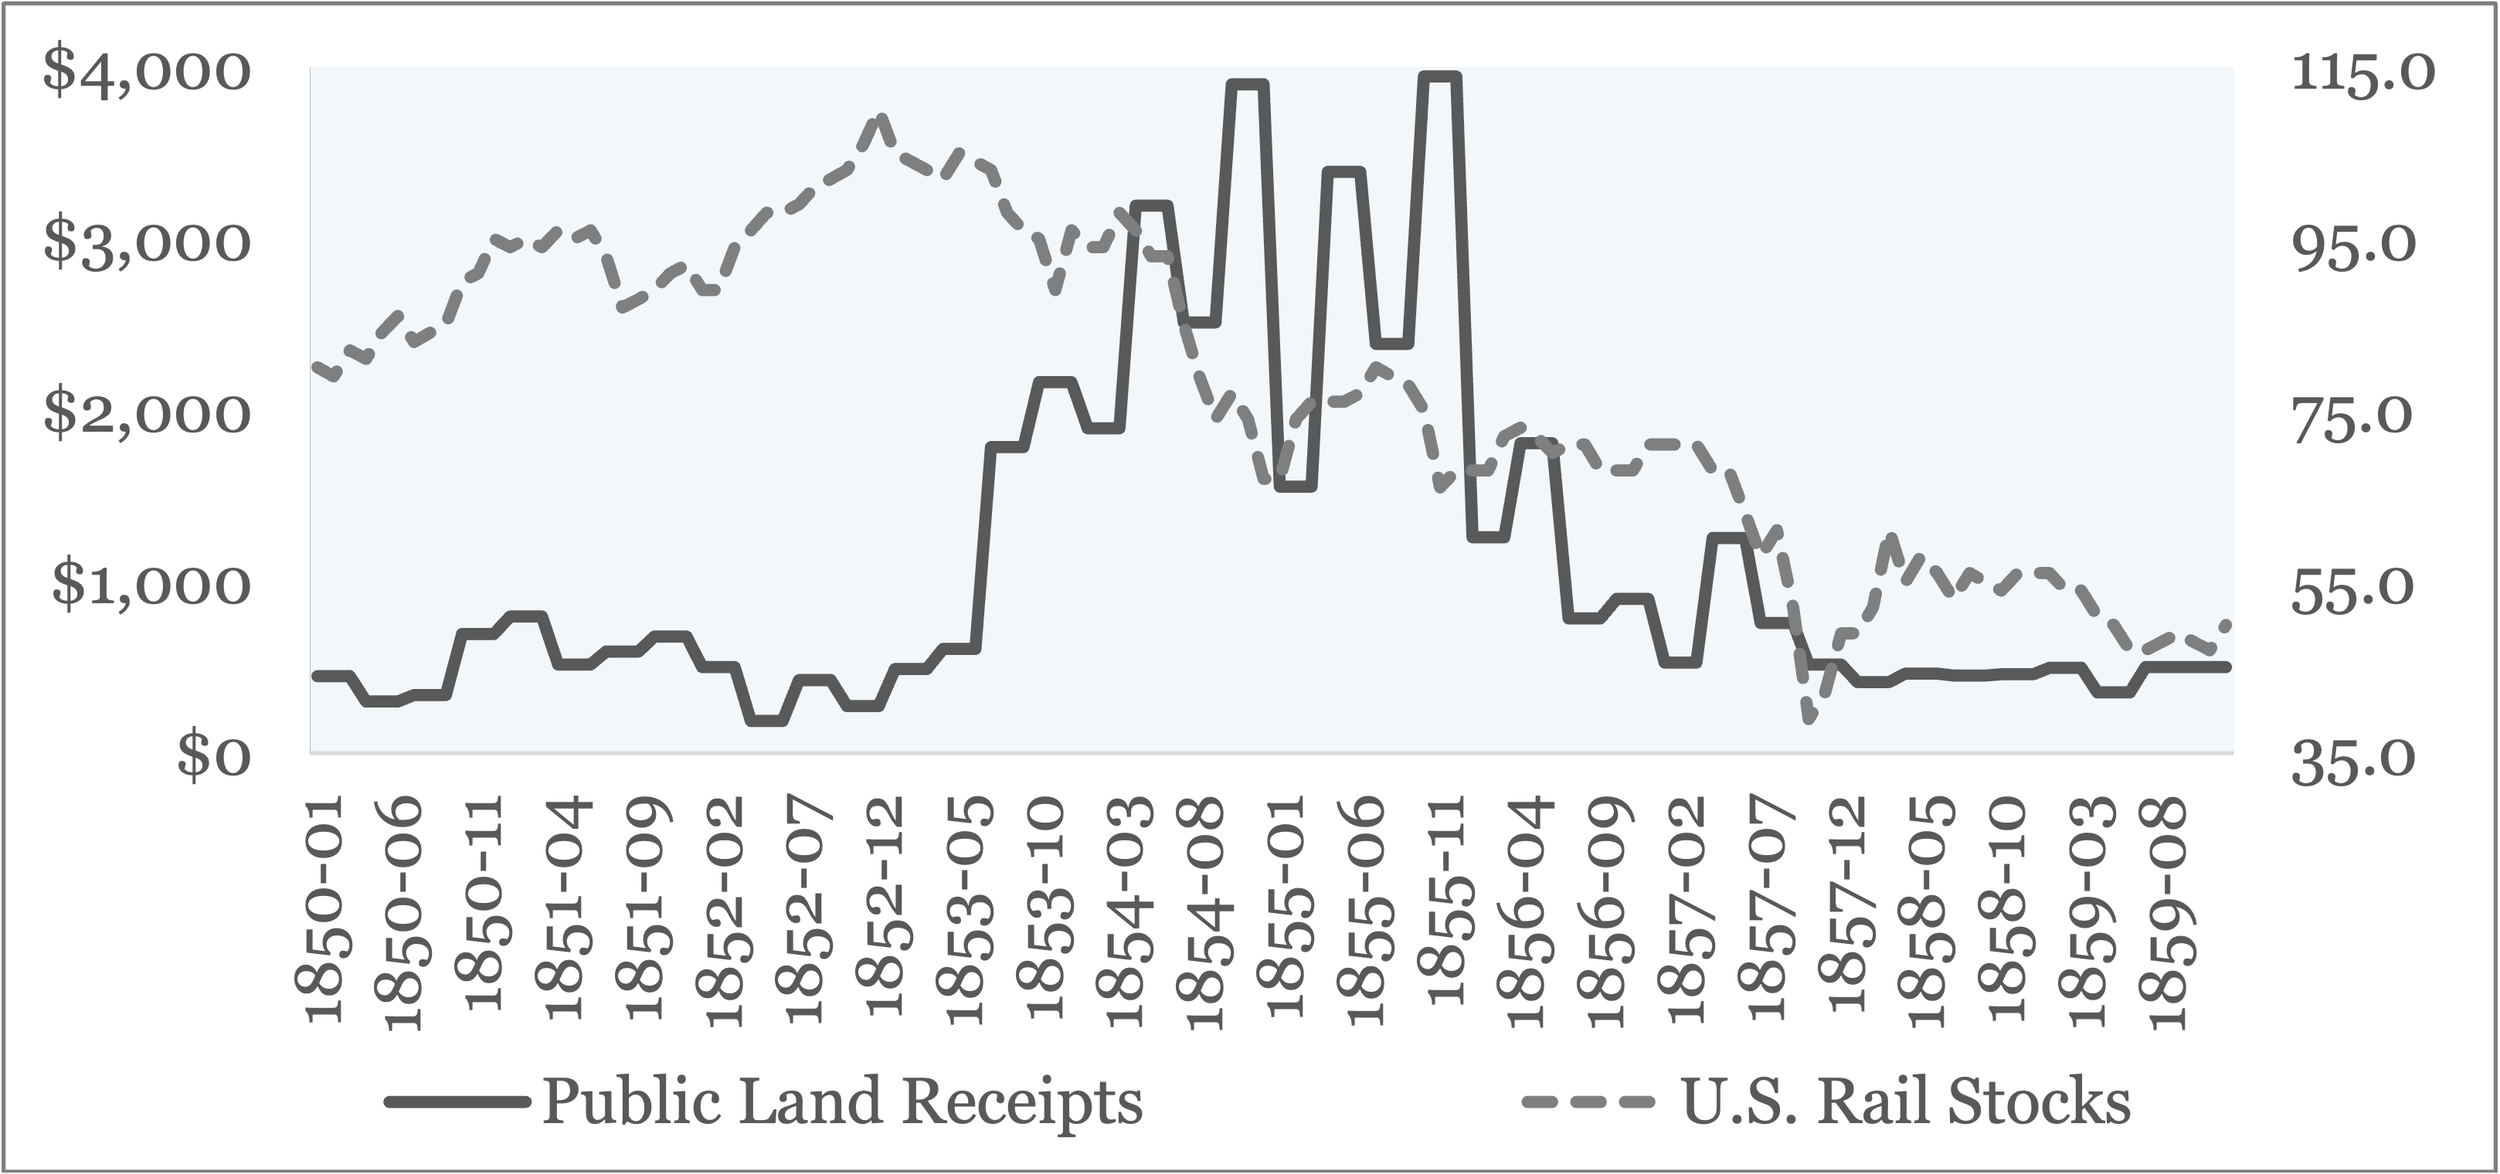
Source: Smith & Cole (1935). Note that Public Land Receipts are in thousands of U.S. dollars, while U.S. Railroad stock prices are indexed to 1853.
What was lost in railroad securities, importantly, was papered over with previously unobserved profits from agricultural exports that were made in connection with the Crimean War. Enveloping the largest grain producer on the Continent, the conflict pulled into production large agricultural swaths of the U.S. that, for the first time, became a core supplier of foodstuffs to Europe, where Glasgow emerged as the central port of trade.[9] Per Figure 3, wheat prices quoted in Chicago jumped as much as 96.3% (from $0.815 to $1.600 per bushel) during the 29-month-long conflict that ended in March 1856, after which prices remained elevated through May 1857, when prices reflected a 6.5% rise (from $1.160 to $1.235 per bushel) during the prior 14 months. But the trade pattern was necessarily ephemeral as demobilization reopened the Black Sea and brought Russian supply back into the fold for the 1857 harvest.[10] Falling 31.6% (to $0.845) in the 3 months ending August 1857, the price of wheat in Chicago would ultimately descend (to $0.545) in November 1857, when prices reflected levels unseen for 5 years.
Figure 3. Agricultural Prices, 1852–58
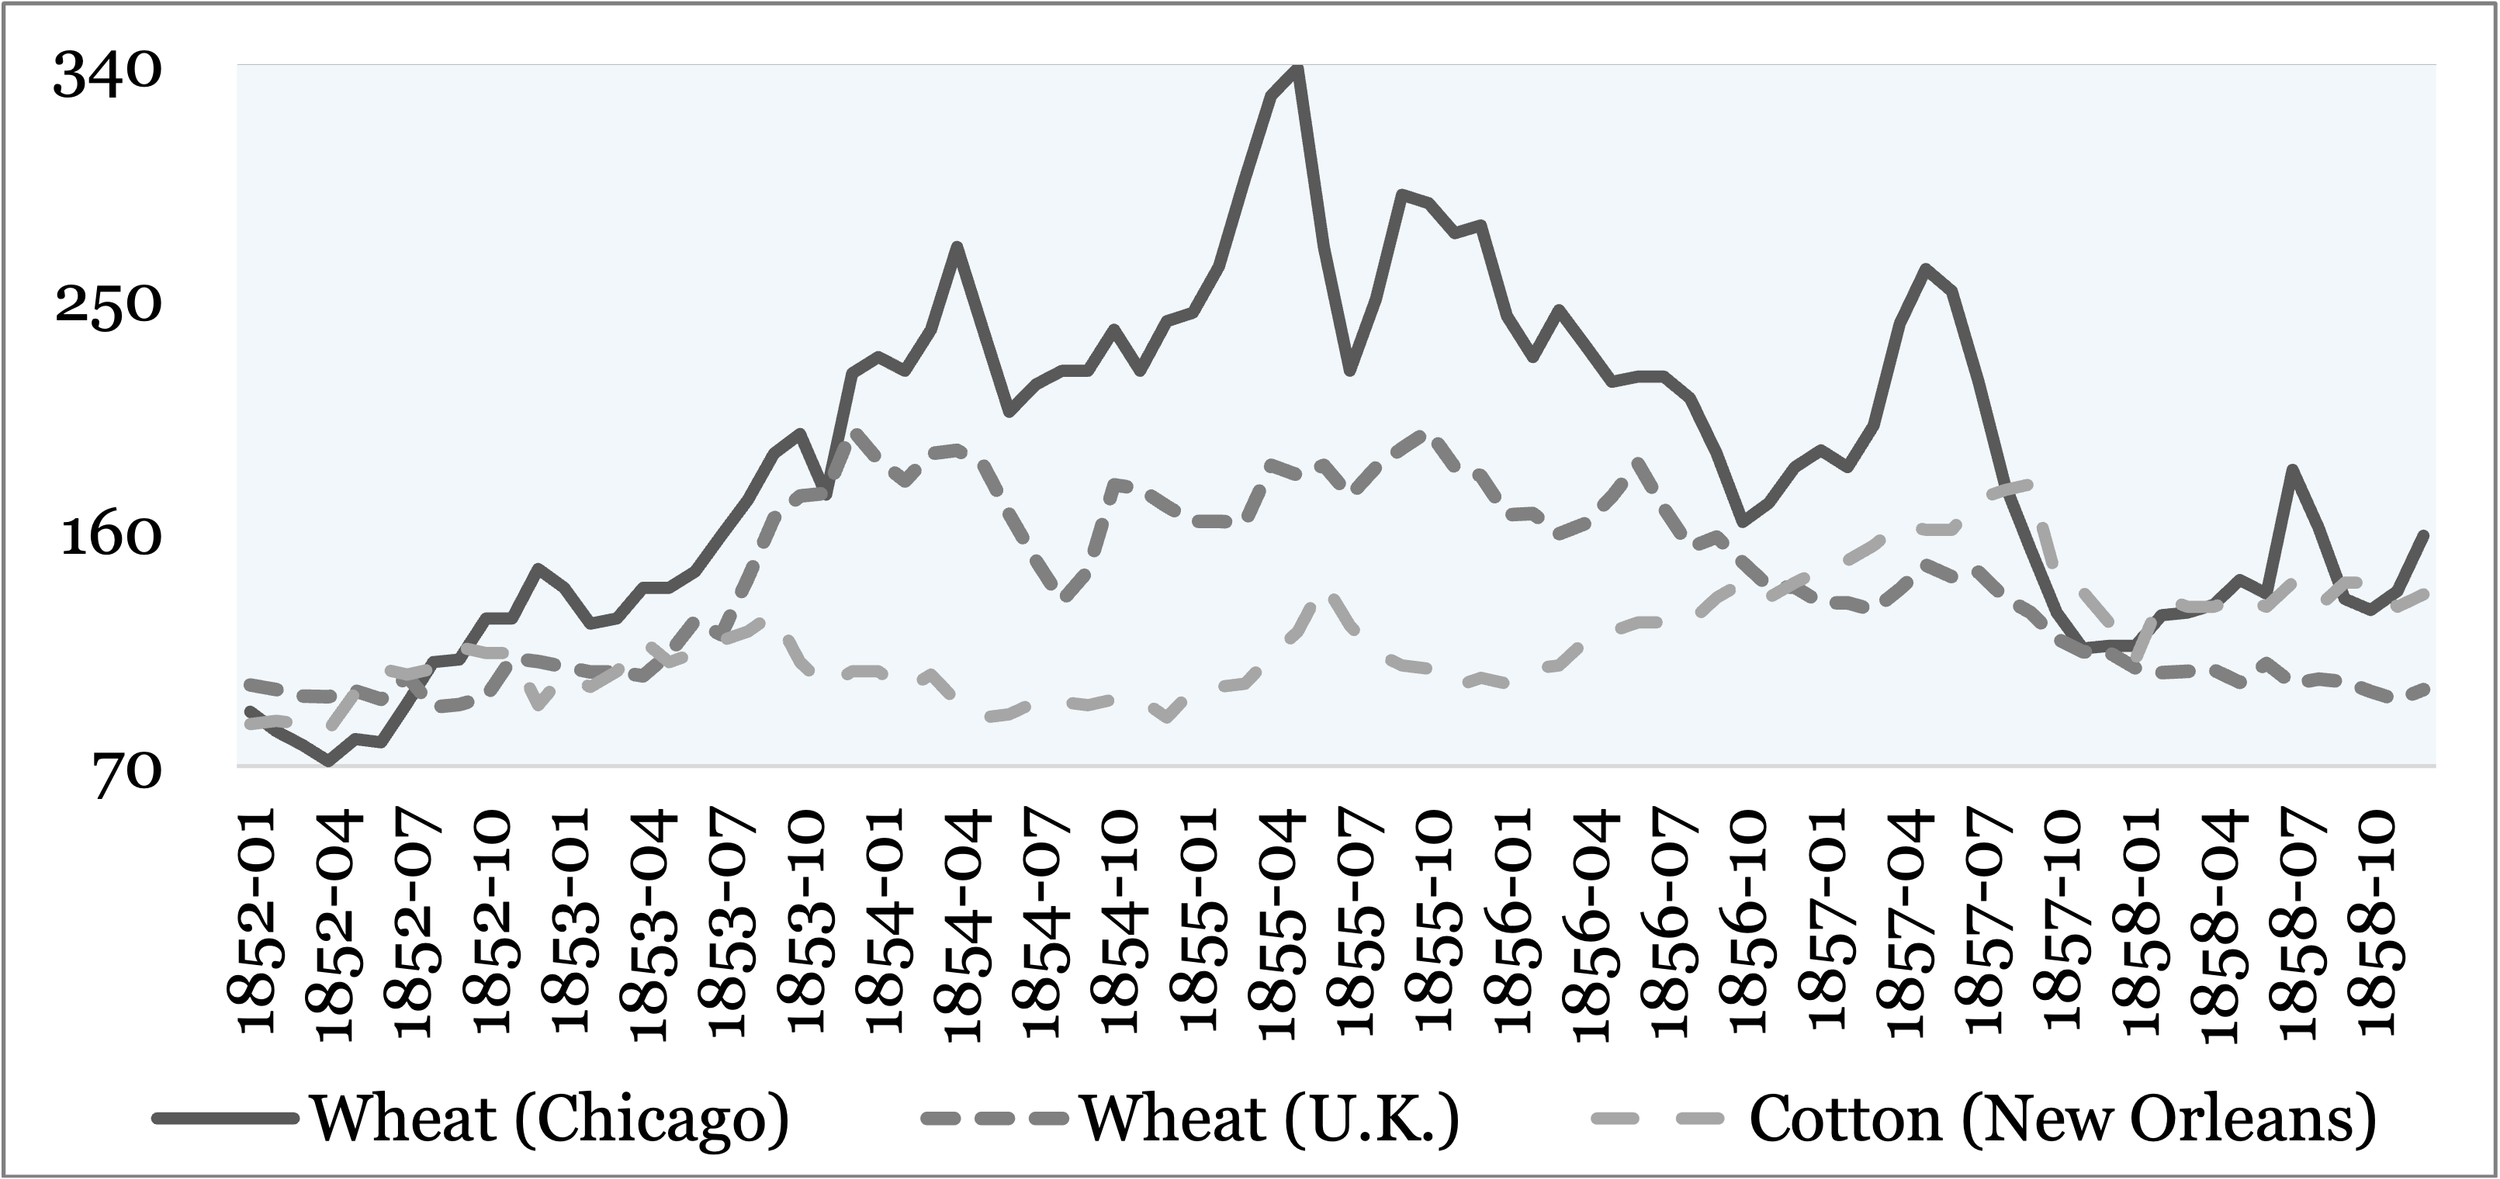
Source: Smith & Cole (1935); Federal Reserve Bank of St. Louis. Note that Chicago prices are in cents/bushel, while U.K. prices are in shillings per quarter and New Orleans figures are in cents per pound. Prices indexed to 1852.
And “with the blindness which is peculiar to such cases, no one saw any sign of the approaching crash,” recounts H.M. Hyndman.[11] It arrived in August 1857 with the failure of the Ohio Life Insurance & Trust Co., a financial services firm with offices in Cincinnati and New York. With its shares quoted at $102 to yield 10% per annum only days earlier, the downfall of this entity “heralded the cataclysm.”[12] Against nominal assets of $4.8 million, the firm had not only acquired $1.0 million of securities issued by rail operators but also extended $2.0 million of loans to the group.[13] Seven weeks later, as the city banks refused to roll the brokers’ paper, several securities houses were unable to meet their debts and forced to close their doors, including Clark, Dodge & Co. and Beebe & Co. In turn, depositor runs materialized at the Metropolitan Bank and the Bank of Commerce.[14] These actions presaged a contraction in lending among New York banks, which reduced their outstanding loans by $12.4 million in the 5 weeks to September 26, when deposits fell by just $7.3 million, showing “beyond cavil, that the banks, not the depositors, took the lead in forcing liquidation.”[15] Thereafter, the malaise was deepened in October 1857, when New York banks experienced deposit withdrawals from country banks that occurred in accordance with a monthly drop of 20.5% in cotton prices (from 15.1¢) to 12.0¢.[16]
Predictably, the price deflation was transferred to commodity houses in the U.K., where the suspension of firms caused a £2 million loss at the Western Bank of Scotland, which maintained £5 million of deposits across 98 branches.[17] After the shuttering of the Northumberland & Durham District Bank and the Liverpool Borough Bank, the panic spread to the Wolverhampton & Staffordshire Bank and the broader iron districts, where blast furnaces went dark in 1857.[18] Altogether, losses in Europe were estimated at $300 million.[19] By comparison, the 5,123 failed firms across the U.S. and Canada carried estimated losses of $204 million, including $60 million related to investment houses and $144 million to commercial enterprises that suffered an estimated 52% recovery rate.[20] In conjunction, 14 railway companies, including the Illinois Central, Philadelphia & Reading, and New York & Lake Erie, suspended payment, and Oliver M.W. Sprague recalls “the construction of many American railways suddenly stopped, because further capital could not be attained.”[21] At the bottom in October 1857, the U.S. rail index reflected a 64.5% decline from the cyclical peak made in December 1852.
Thus, intimately connected to the Crimean War and to a lesser extent the sale of public lands, the misadventure in finance during the 1850s is best attributed to an overextension of the trend in the new issues market, in which “the incapacity of the heads of the capitalist system to regulate the amount of capital expended on the development of different branches of industry” was fully demonstrated, with losses magnified by a deflation in commodity prices.[22] It bears mention that a similar bout of deflation – both undeniable and ill explored – deepened security losses in 1931, when agricultural prices softened after the commodities of the Soviet Union, for the first time since 1917, were dumped into the international market.[23] Nonetheless, the episode in 1857 is representative of speculative bubbles centered in fixed income instruments that, historically, have been terminated by bank failures that compel outsized liquidation.
Charles Lister Smith, PhD
August 25, 2026
[1] Having averaged $9 million per annum between 1492 and 1850, gold production soared to $133 million per annum during the 1850s. Had species not been found in abundance, one reckons land would have been purchased with bank-issued paper that lacked the characteristics of high-powered money. In other words, the same extension of credit would have been unattainable. Charles A. Conant, A History of Modern Banks of Issue, 5th ed. (G.P. Putnam’s Sons, 1915), 637.
[2] So eager was it to deploy the surplus funding that the U.S. Treasury purchased obligations in the open market at a 21% premium to their face value; David Kinley, The Independent Treasury of the United States and its Relations to the Banks of the Country (Government Printing Office, 1910), 223.
[3] "The Financial Review," Commercial & Financial Chronicle, vol. 86, no. 2224 (February 8, 1908), 68.
[4] H.M. Hyndman, Commercial Crises of the Nineteenth Century, 2nd ed. (George Allen & Unwin, 1932), 73.
[5] U.S. Treasury, “Report of the U.S. Treasury in Answer to a Resolution of the Senate Calling for the Amount of American Securities Held in Europe and Other Foreign Countries on the 30th of June 1853,” March 2, 1854, 54. www.govinfo.gov/content/pkg/SERIALSET-00698_00_00-015-0042-0000/pdf/SERIALSET-00698_00_00-015-0042-0000.pdf.
[6] “The Panic and Financial Crisis of 1857,” Hunt’s Merchants’ Magazine and Commercial Review, vol. 37, no. 6 (December 1857), 665.
[7] Edward James Morgan, “Sources of Capital for Railroads in the Old Northwest Before the Civil War” (PhD diss., University of Wisconsin, 1964), 413.
[8] Morgan, “Sources of Capital,” 412.
[9] James L. Huston, The Panic of 1857 and the Coming of the Civil War (Louisiana State University Press, 1987); Scott Reynolds Nelson, Oceans of Grain: How American Wheat Remade the World (Basic Books, 2022).
[10] A source of debate, the decline in wheat prices during the fall of 1857 is attributed to a bumper harvest by Calomiris and Schweikart, while James Huston credits the drop to the fall-off in demand following the Crimean War. By contrast, this assessment recognizes that the price swing is uniform with the resumption of Russian exports, choked off by the blockade of the Black Sea and restored for the 1857 harvest. Notably, this understanding is supported by the divergence in wheat prices in the U.S. and U.K. in the 3 months ending October 1857, when the former declined by 27.8% and the latter by 11.7%, which is indicative of a returning supply rather than a contraction in foreign demand. Additionally, the deflation is consistent with the experience following the Napoleonic Wars and World War I; for reference, see the testimony of Benjamin Strong in U.S. Congress, Hearings Before the House Committee on Banking and Currency, First Session, on H.R. 11806 (U.S. Government Printing Office, March 1928), 17.
[11] Hyndman, Commercial Crises, 71.
[12] Charles Albert Collman, Our Mysterious Panics, 1830–1930: A Story of Events and the Men Involved (William Morrow & Co., 1931), 84.
[13] Mortimer Spiegelman, “The Failure of the Ohio Life Insurance and Trust Company, 1857,” Ohio State Archaeological and Historical Quarterly 57, no. 3 (1948): 263; Charles W. Calomiris and Larry Schweikart, “The Panic of 1857: Origins, Transmission, and Containment,” Journal of Economic History 51, no. 4 (1991): 817.
[14] Collman, Our Mysterious Panics, 85.
[15] J.S. Gibbons, The Banks of New York, Their Dealers, the Clearing House, and the Panic of 1857 (D. Appleton & Co., 1859, reprinted by Greenwood Press, 1968), 354.
[16] Lewis Cecil Gray, History of Agriculture in the Southern United States to 1860 (Carnegie Institution of Washington, 1933), 1027.
[17] D. Morier Evans, The History of the Commercial Crisis, 1857–1858 and the Stock Exchange Panic of 1859 (Groombridge & Sons, 1859, reprinted by August M. Kelley, 1969), 35.
[18] Evans, The History of the Commercial Crisis, 36.
[19] Evans, The History of the Commercial Crisis, 113.
[20] Evans, The History of the Commercial Crisis, 125.
[21] O.M.W. Sprague, “The American Crisis of 1907,” Economic Journal 18, no. 71 (1908): 356; Hyndman, Commercial Crises, 76.
[22] Hyndman, Commercial Crises, 74. See also “The Panic and Financial Crisis of 1857,” Hunt’s Merchants’ Magazine and Commercial Review, vol. 37, no. 6 (December 1857), 665.
[23] Outside of any existing scholarly literature, the topic of Soviet commodity exports and deflation during the Great Depression is addressed by this author in forthcoming research.