
While intimately connected to an exogenous shock in oil prices, it is equally true that the Bear Market of 1973-74 followed a material expansion in the money supply that fed a pronounced boom in the capital markets. Per Figure 1, the U.S. money supply grew by 22.9% (from $686 billion) to $843 billion in the 26 months after the U.S. formally removed the dollar from the gold standard in August 1971 and before OPEC instituted an embargo in October 1973 that was followed by a 134.6% increase in West Texas Intermediate (WTI) spot oil prices in January 1974.
Figure 1. U.S. Money Supply, Federal Debt vs. WTI Spot Oil Price
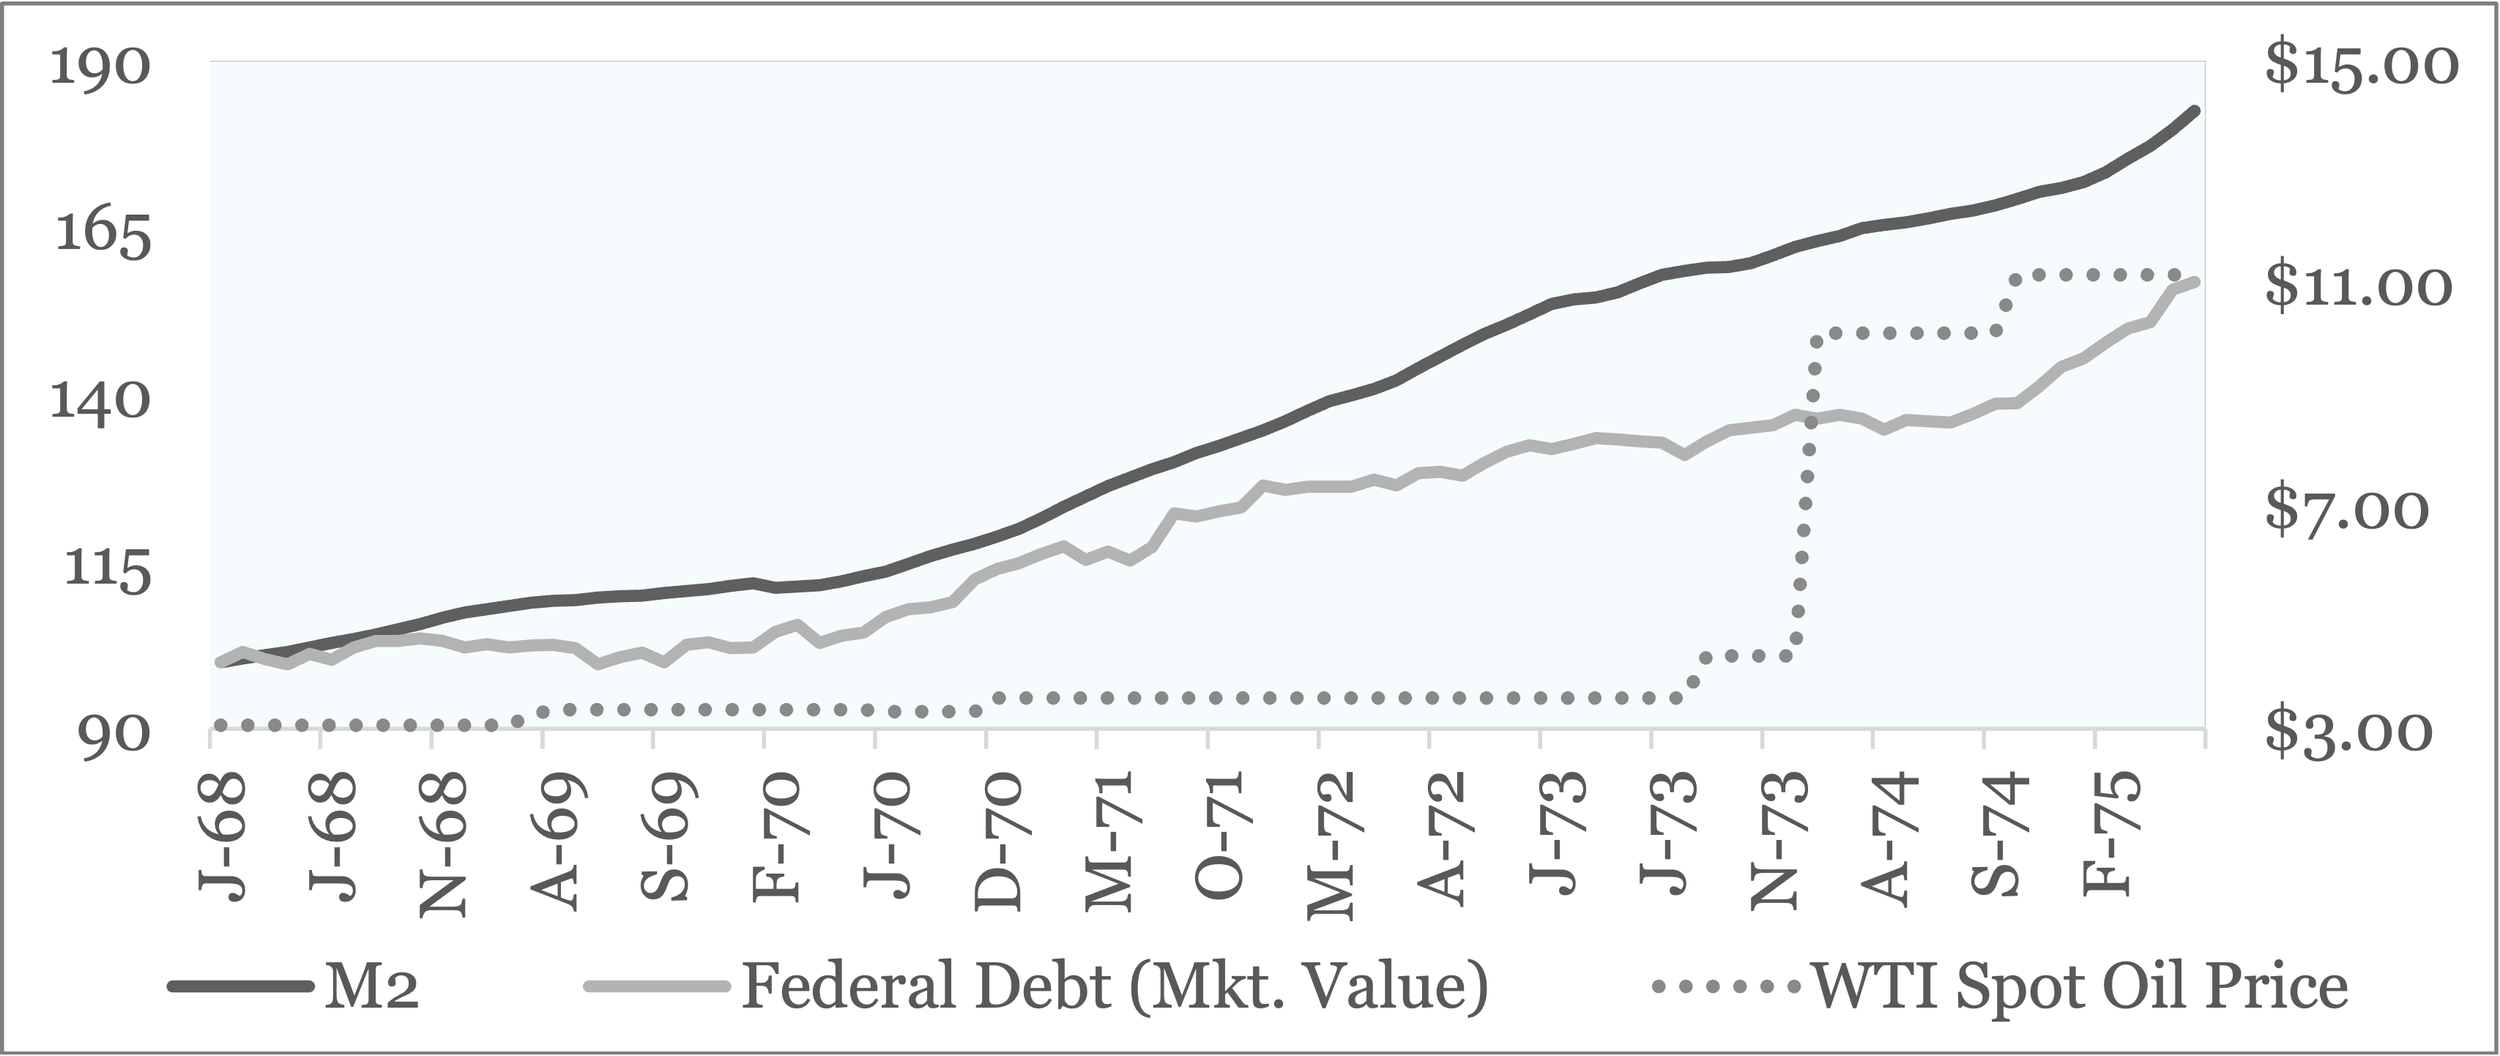
Source: Federal Reserve Bank of St. Louis. Note that M2 and the market value of the Federal Debt are indexed to January 1968.
The increase in the money supply was felt in the new issues market, where stock offerings surged from $4.6 billion in 1968 to $13.1 billion in 1972, before trailing off to $11.1 billion in 1973, when the downturn in stock prices commenced. Consisting of the largest IPO volumes since 1929, the boom included such notables as Intel Corp. (October 1971), Southwest Airlines (June 1971), MCI Communications (June 1972), and Comcast Corp. (June 1972). However, the speculative element was centered on REITs, which captured 16.0% of total stock volumes in 1972 and as much as 76.9% in March 1973, when monthly volumes peaked at a remarkable $1.8 billion.[1] Meanwhile, stock price gains were downright muted when compared to prior boom periods. In the 36 months to January 1973, the DJIA advanced just 41.4% (from 744.06) to a cyclical peak of 1,051.70.
Figure 2. U.S. Stock Issues vs. Dow Jones Industrial Average
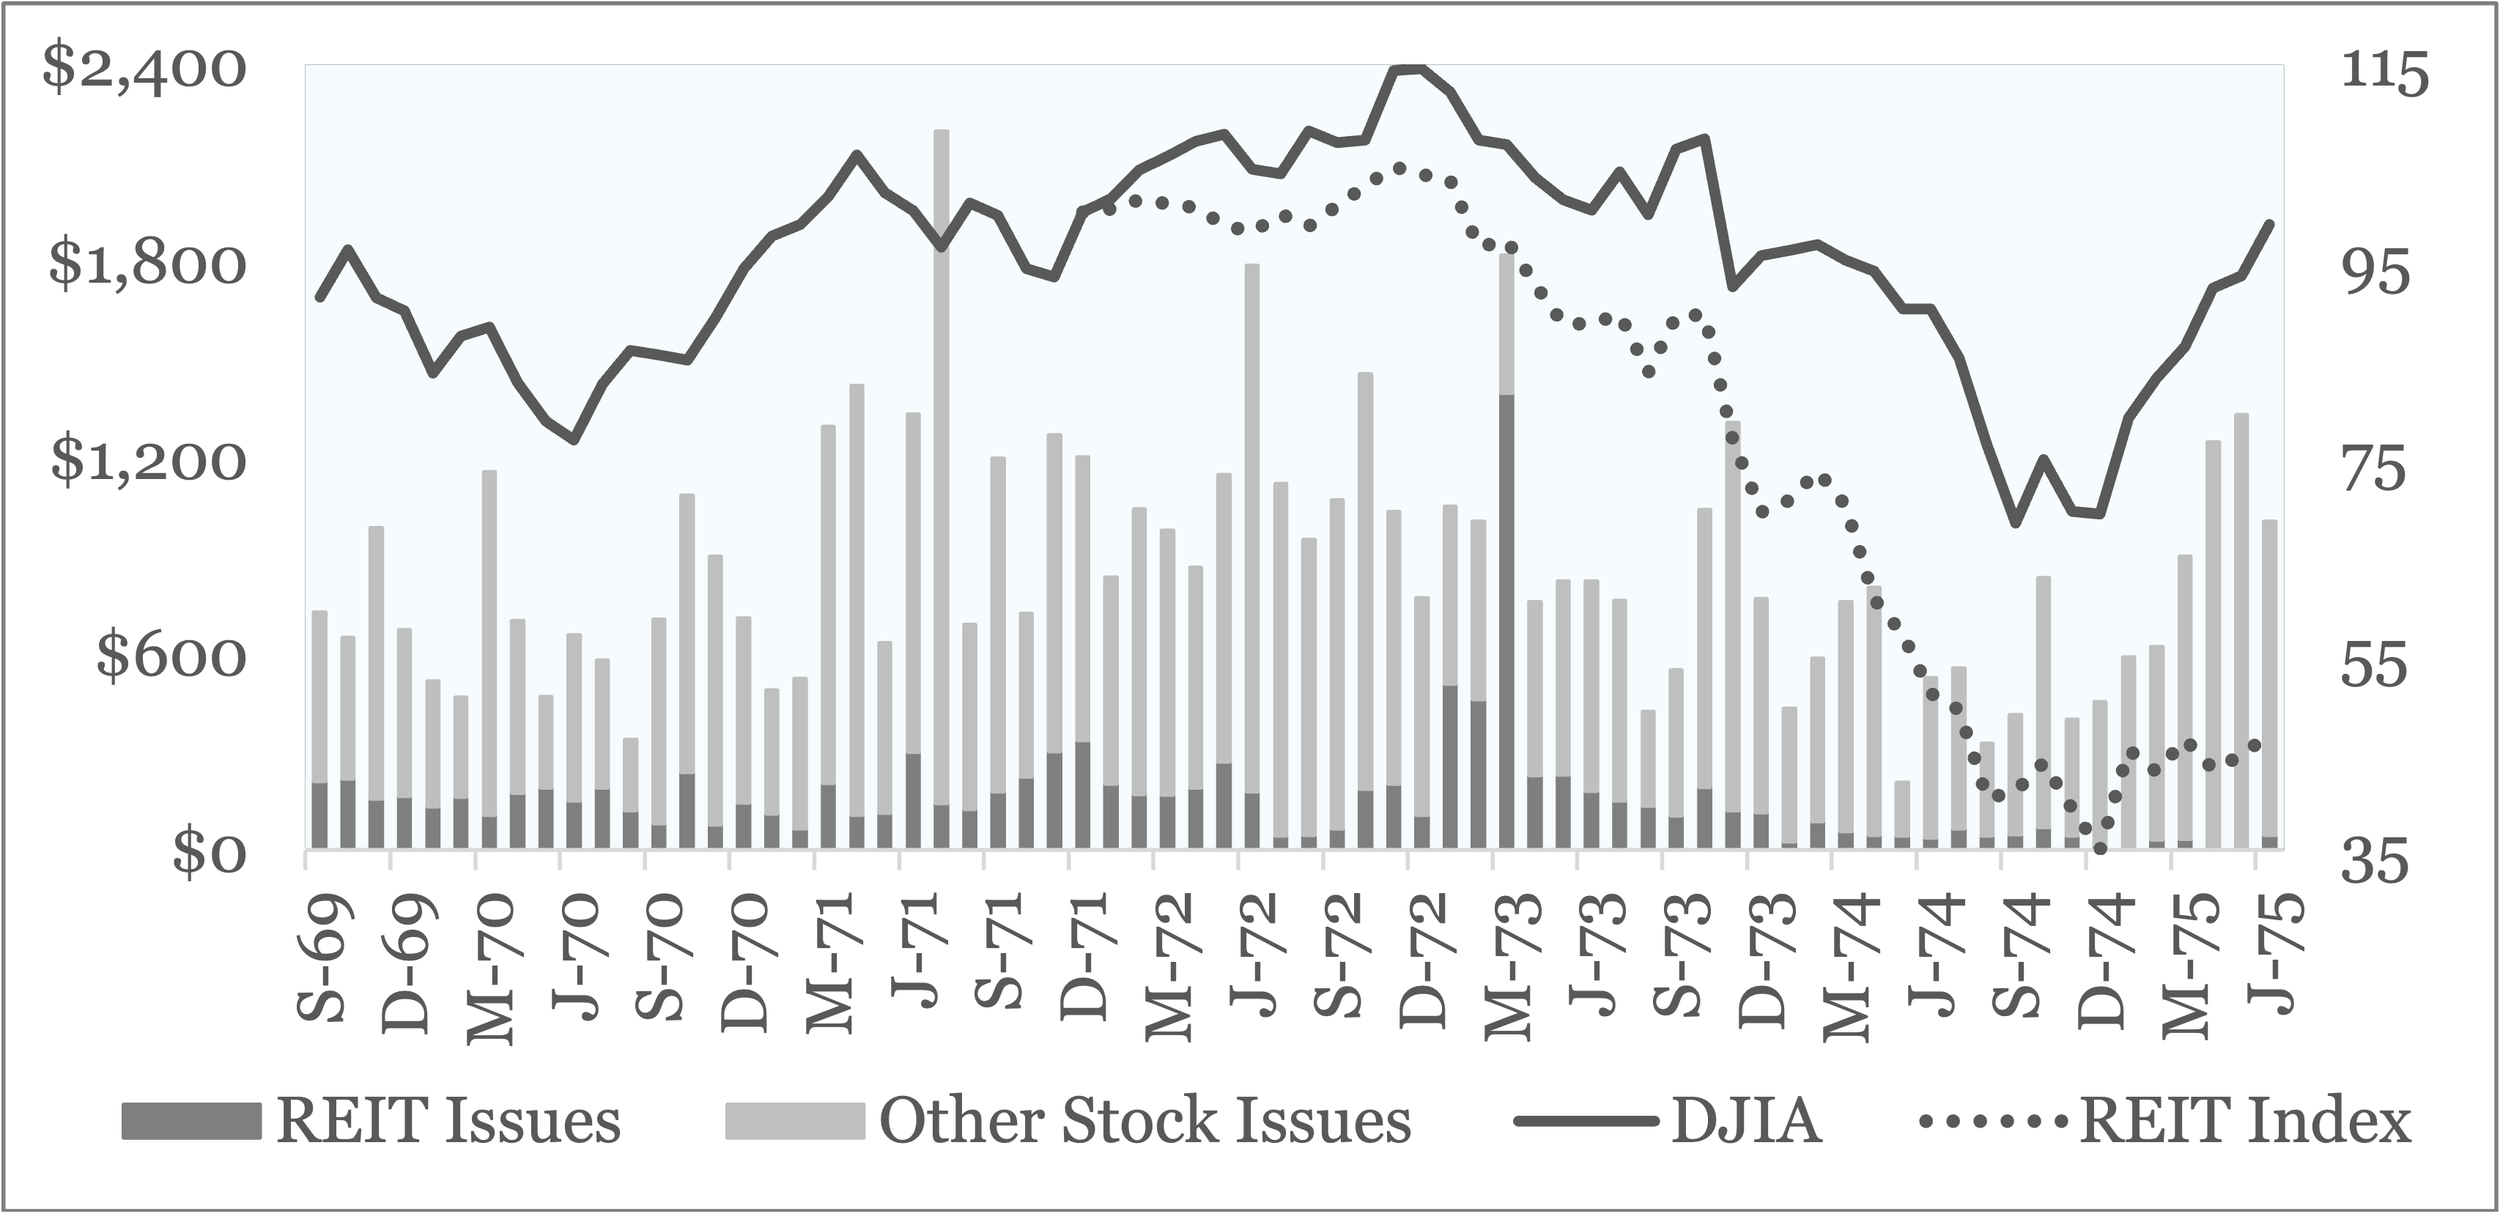
Source: Federal Reserve Board, Federal Reserve Bulletin (1970-75), Federal Reserve Bank of St. Louis, and NAREIT. Note that AT&T issued $1.4 billion of convertible preferred stock in July 1971.
What uplift existed in the capital markets at the outset of 1973 was undercut by a dramatic rise in short-term market yields. Untethered from the gold standard in August 1971, outsized budget deficits fostered a peacetime expansion in the Federal Debt unobserved since the 1930s that compelled the Nixon Administration to pursue a 10% devaluation of the dollar against gold in February 1973.[2] This action terminated the fixed parity exchange rates set 14 months earlier in the Smithsonian Agreement, removing the incentive for foreign entities to continue holding assets in U.S. dollars. Consequently, the largest buyers of U.S. Government securities turned to sellers, at a time when the growth of the Federal Debt was accelerating in pace. In turn, the gap was largely filled by the Treasury, which acquired a larger share of the Federal Debt (see Figure 3) with funds utilized from Government trusts and agencies, including in August 1973 when bids of $260 million (only) were received on a $500 million 20-year bond.[3] Because funds were available in abundance but only at higher rates, analysts at Lehman Brothers described conditions at that time as a “money crunch,” a definition that is interchangeable with the notion of a sovereign debt repricing expressed here.[4]
Figure 3. Ownership of the U.S. Federal Debt
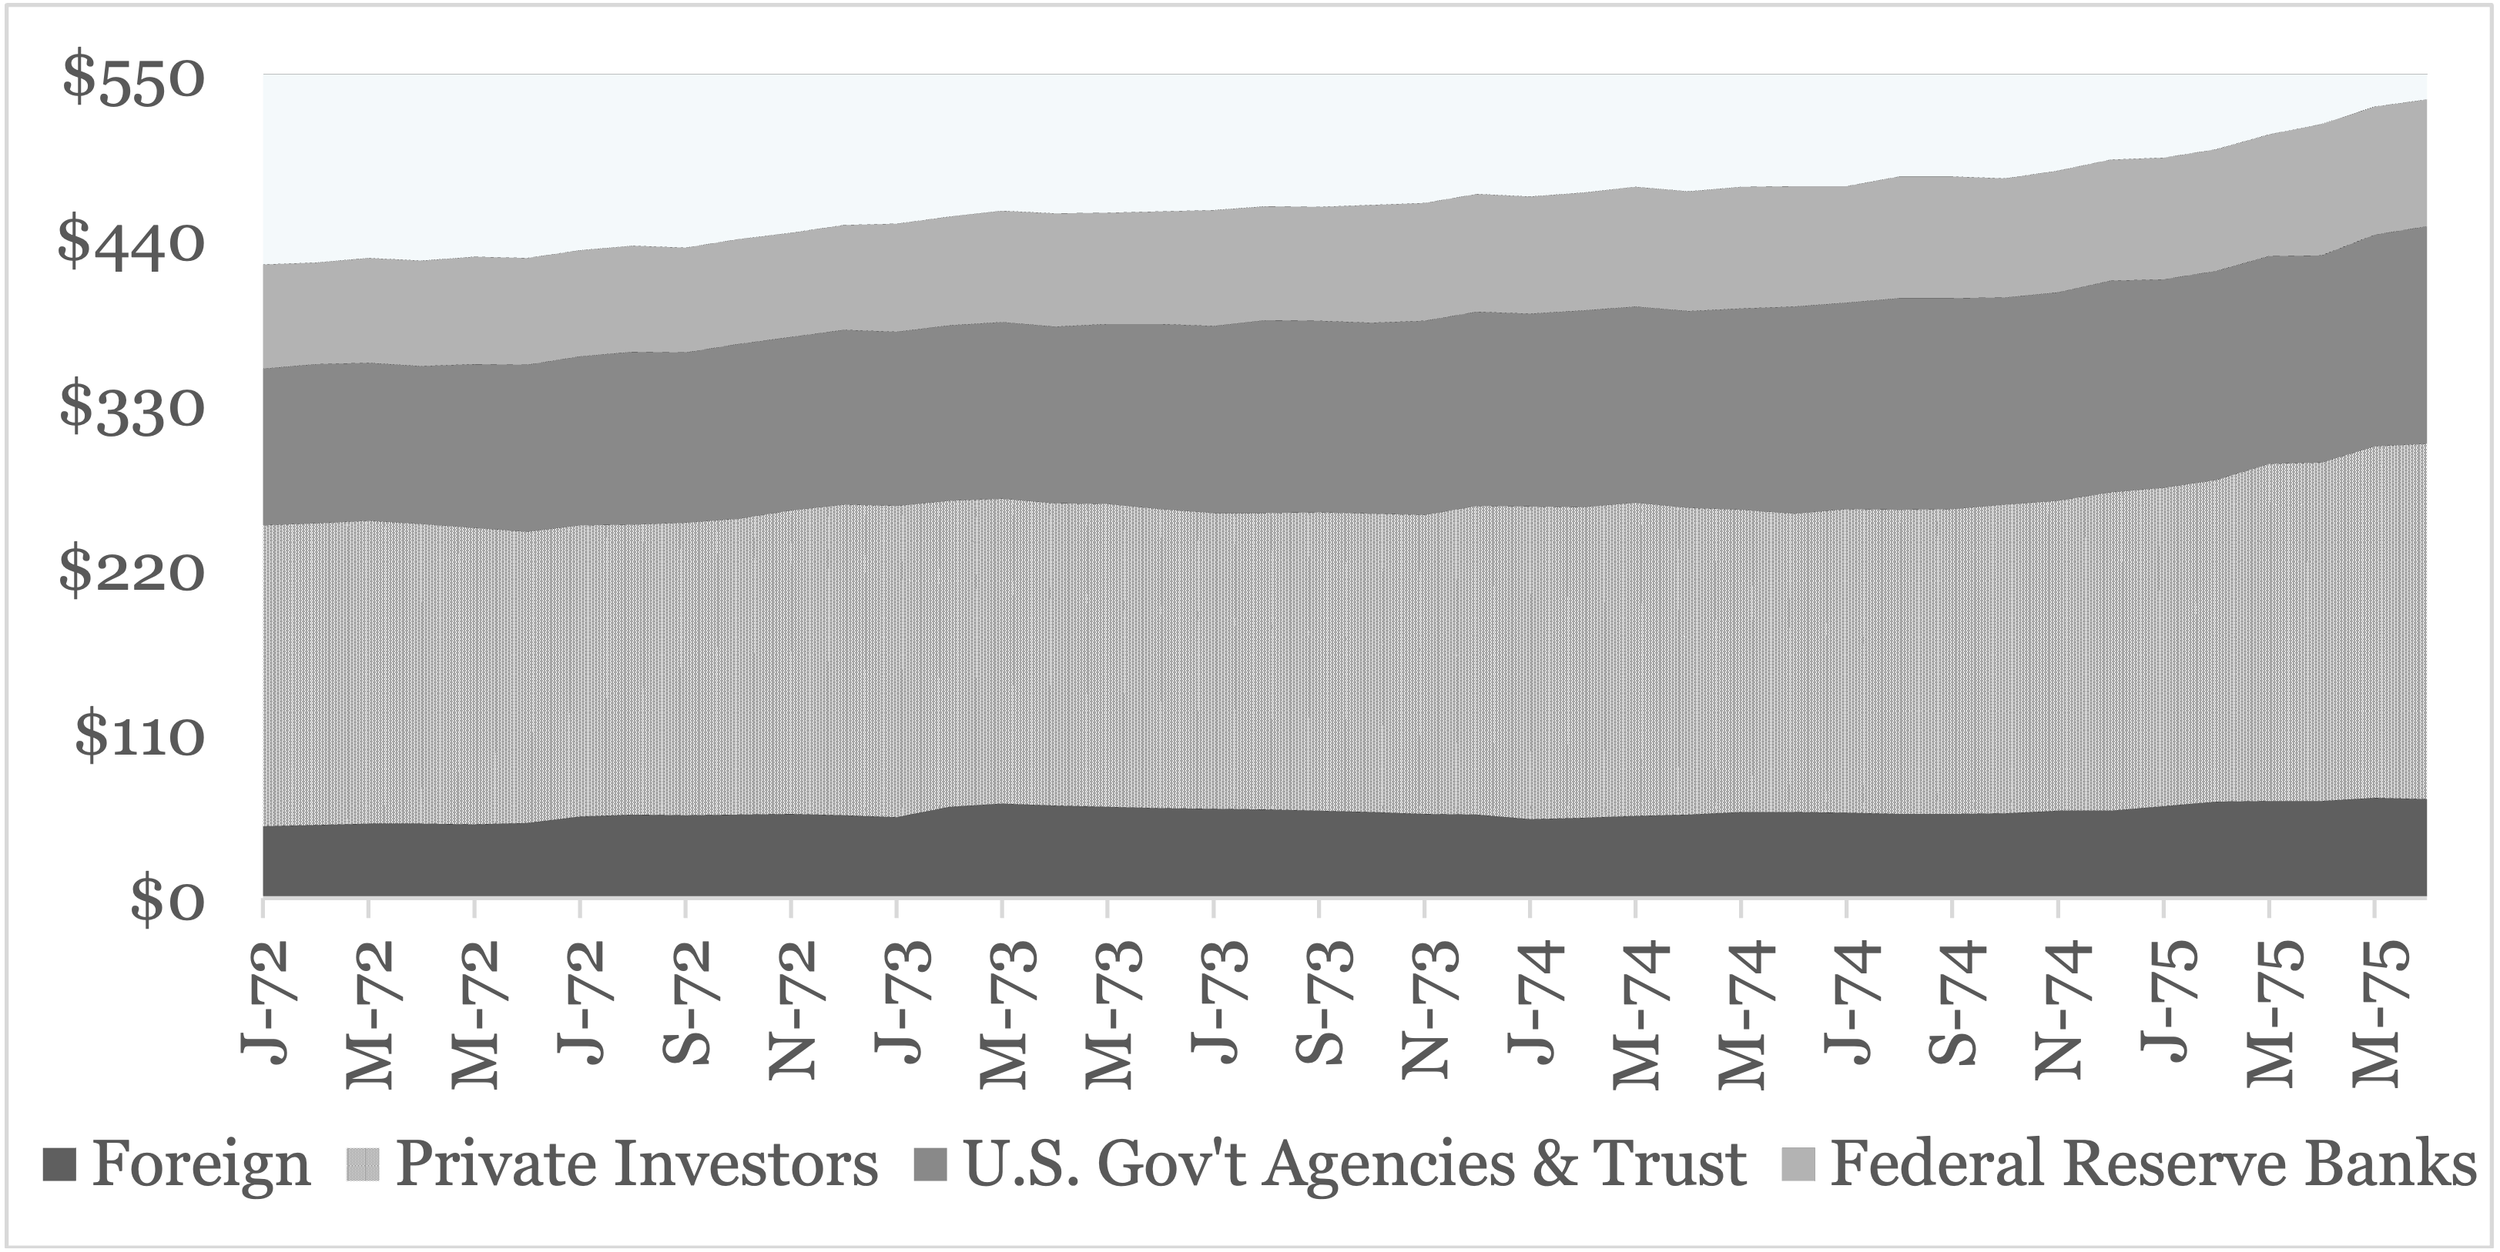
Source: Federal Reserve Board, Federal Reserve Bulletin, 1972-1975.
The confluence of falling demand and rising supply was predictably expressed in the path of short-term interest rates.[5] Per Figure 4, market yields on 3-month Treasury Bills surged from 5.06% to 8.48% in the initial 9 months of 1973.[6] No small item, the 342-bps gain in U.S. short-term market yields was reflected in stock price declines, including a 19.0% drop in the DJIA between the peak on January 11 and the closing price (of 851.9) on August 22. The downward movement was then arrested, albeit briefly, on account of favorable trade surplus data for September 1973, such that the DJIA, at 967.41, indicated a 7.7% decline from its high point on the eve of the OPEC embargo in October 1973.[7] The episode would stretch five months, to March 1974. In the period, the DJIA plunged 18.5% (to 788.31) in the 7 weeks to December 5, when the index reflected a 25.0% decline from its cyclical peak. But in conjunction with OPEC action that caused the WTI spot price to jump 134.6% (from $4.31/barrel) to $10.11/barrel on January 1, the DJIA gained 13.1% in 14 weeks to reach 891.66 on March 13.[8] No less than 5 days later, the OPEC embargo would be terminated.
Figure 4. U.S. Market Yields vs. DJIA
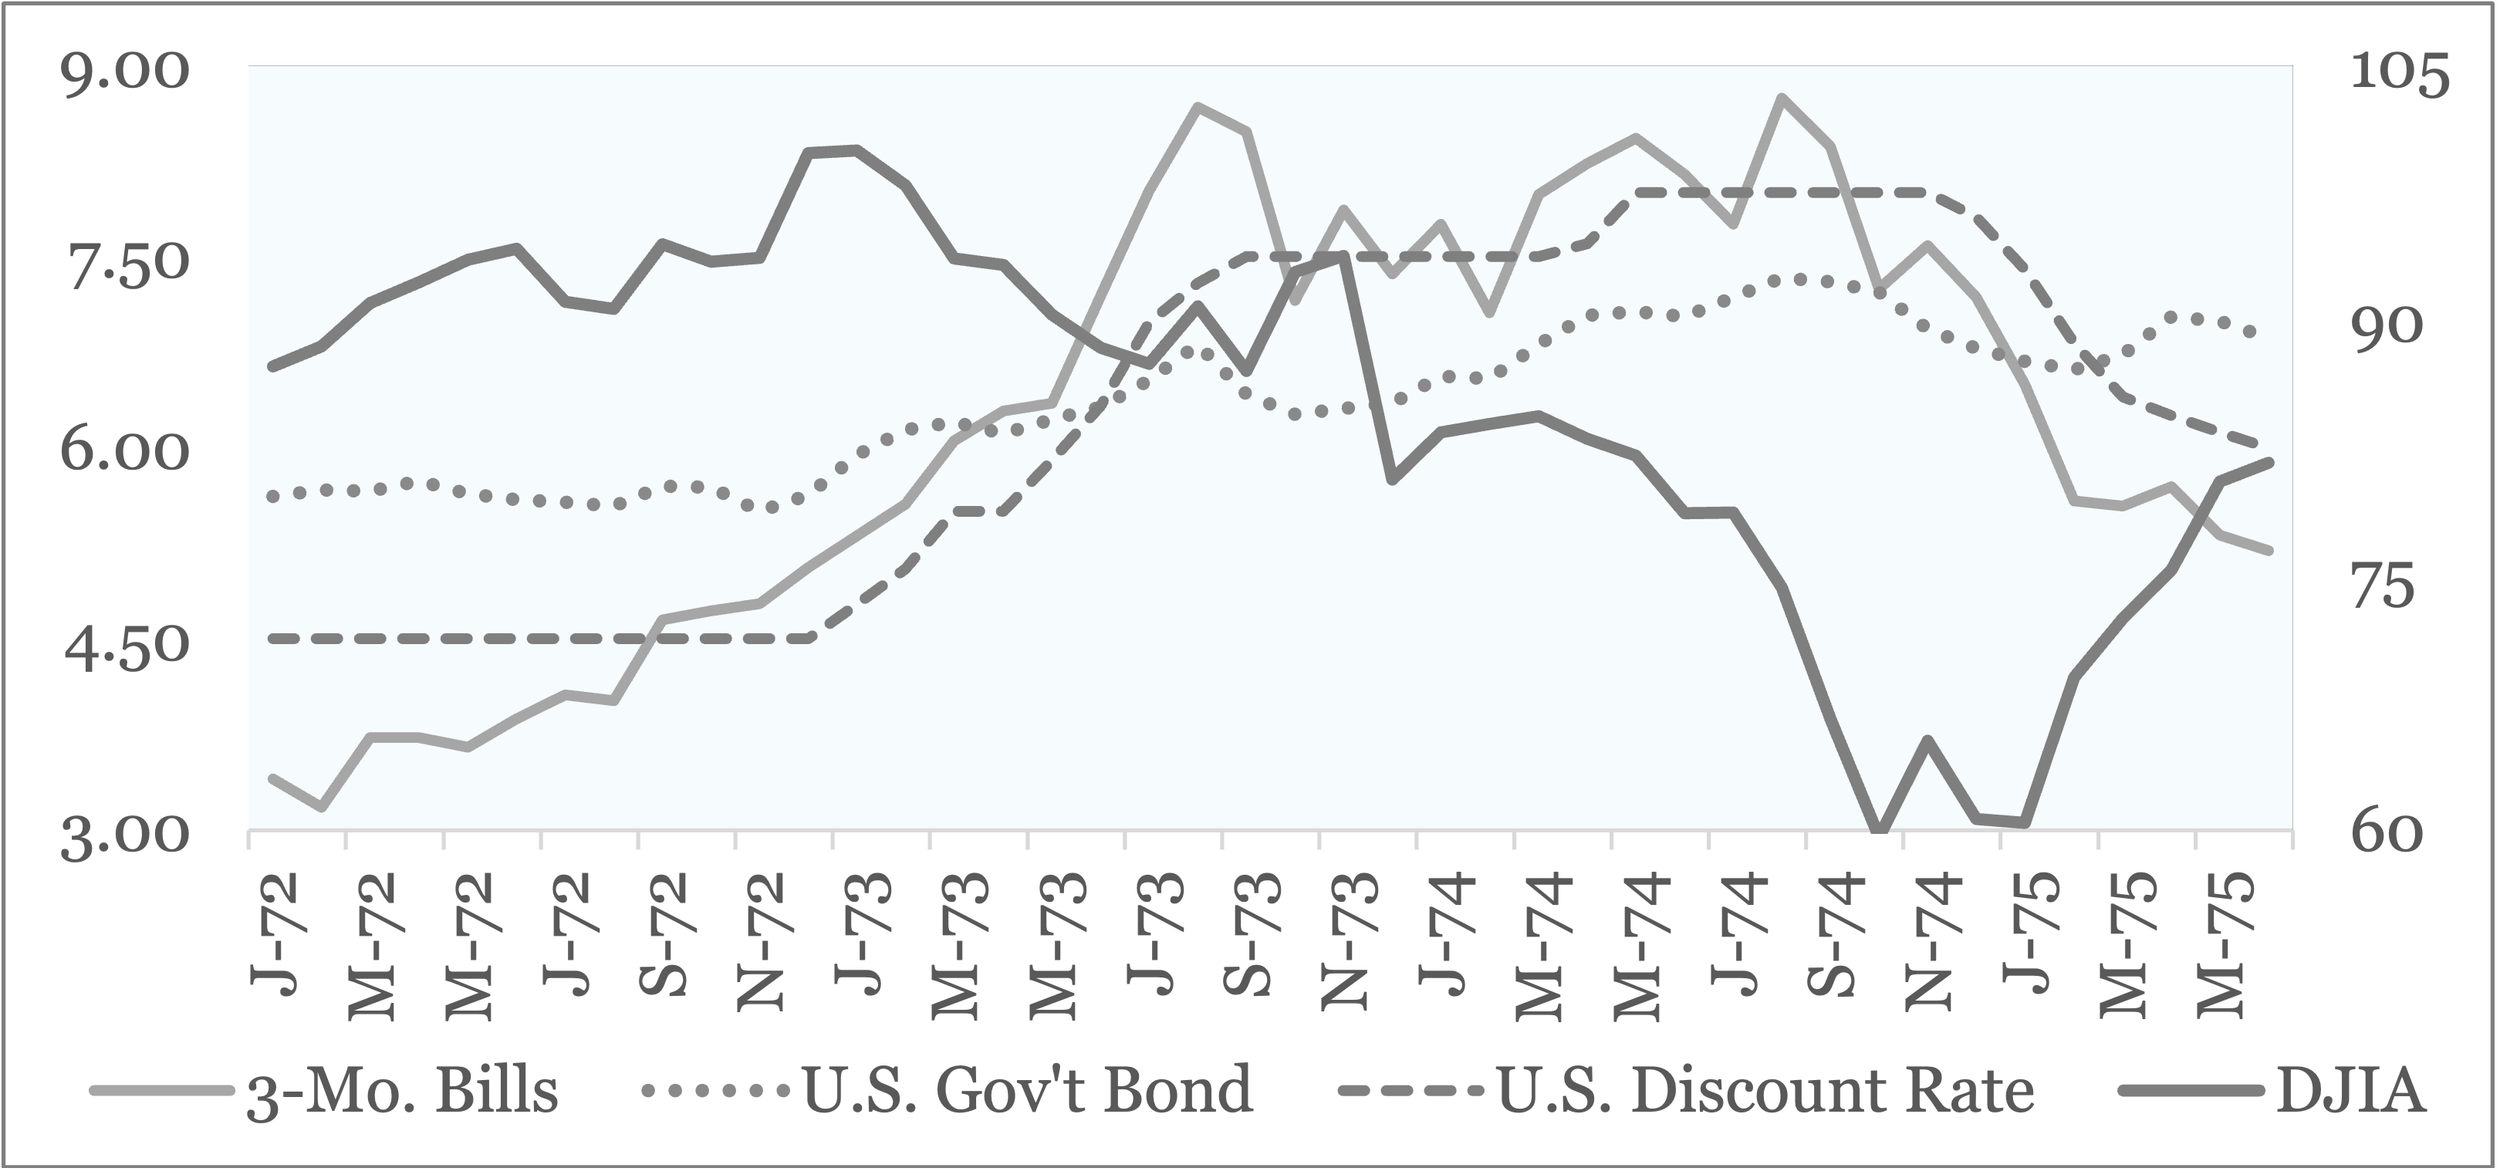
Source: Federal Reserve Board, Monthly Bulletin (1970-75); index data from FRED and NAREIT.
What equilibrium existed in March 1974 – that is, after the resolution of the OPEC embargo – was promptly upturned by a renewed increase in short-term market yields. As a reference, in the 6 months to August 1974, the market yields of 3-month Treasury Bills advanced a remarkable 171 bps (from 7.03%) to 8.74%. Bearing little relation to the corresponding 50-bps increase in the discount rate of the Federal Reserve Banks, this upward spike can be credited to a material unwinding of U.S. Government securities by Japan, whose holdings contracted by 40.7% (from $6.0 billion) to $3.5 billion in the 6 months ending April 1974.[9] It further dovetailed with a pronounced drop in stock prices in the last 9 months of 1974, when declines were deepened by the Watergate scandal that publicly identified President Nixon as an unindicted co-conspirator in June 1974, two months in advance of his resignation. For its part, the DJIA fell 35.2% in the last 9 months of 1974 to reach 577.6 on December 6, when the index reflected a 45.1% drop from the cyclical peak made 22 months earlier.
Taken as a whole, it can be stated, quite lucidly, that the Bear Market of 1973-74 was initiated by a repricing of U.S. Government securities brought about by the largest peacetime expansion in the Federal Debt since the Great Depression. Indeed, a repatriation of foreign capital is the expected reaction to the fiscal abnormality. It is in accordance with the profit motive. The tendencies of supply and demand are further, clearly, expressed in the market yields for 3-month Treasury Bills that both moved in advance of each tightening in the discount rate of the Federal Reserve Banks and inverted with the path of long-term U.S. Government securities between April 1973 and January 1975, when the downward pressure on stock prices was most acute.
For the uninitiated, it must be stressed that supply/demand imbalances in sovereign debts do not form without consequence. Rather, the instruments constitute the risk-free rate upon which all other securities are valued. In such a capacity, the expected outcome of a repricing of sovereign debt is a disproportionate decline in stock prices. That it occurred in the period supports the point. Of course, the OPEC decision exacerbated the declines. But just as the DJIA fell by 18.5% in the 7 weeks after the initial announcement in October 1973, so too did the index rise by 13.1% in the ensuing 14-week stretch. As such, if one credits the oil price shock with the related 18.5% drop in the DJIA, it is still necessary to allocate what remains of the 45.1% contraction to other sources. This relationship is unsurprising when it is remembered that the increase in oil prices was itself a response to the price inflation engineered by the growth in the Federal Debt. Indeed, the shock that was delivered is best understood as emanating from the singular and not easily predictable price increase that occurred in January 1974. Such a notion is consistent with the surprisingly de minimis impact observed in more recent commodity shocks.[10]
Additionally, a certain portion of the decline in U.S. stock prices must be apportioned to the outpouring of stocks – the largest since the late 1920s – in the new issues market. After all, the floodtide not only competed with the existing pool of stocks but also contributed directly to the demise. To that end, of the $21 billion accumulated in REITs between 1969 and 1974, an estimated $11 billion was lost in the following 4 years, when heavily leveraged mortgage trusts collapsed under rising short-term rates.[11] Paralleling similar precedents, the losses incurred by REIT investors were sufficient to repel a generation from the asset class. Built on short-dated leverage against long-dated property, the newly issued REITs could not withstand the rise in yields that their very offering helped engender.
Once the new issues market is pulled forward, the U.S. experience during 1973-74 bears a striking resemblance to 1919 and 1937, when IPO waves, similarly, were brought into contact with a repricing of U.S. Government Securities. In stark contrast with these episodes, however, the damage could not be dampened with the introduction of open market operations as in 1921 or with the transfer of gold profits into the reserve base of member-banks. Thus, where the DJIA recovered to its 1919 peak within 61 months and its 1937 summit within 97 months, the top recorded in January 1973 went uneclipsed for 116 months.
Unique for its inclusion of an oil price shock, the downturn in 1973-74 is, eerily, reflective of the present environment. To the extent cryptocurrencies are crowded out by the forthcoming supply shock in the stock markets, the glut of U.S. Government securities could combine with the loss of demand from a principal buyer to produce price returns of a similar caliber. If anything, the set-up shows how the broad indexes could encounter crippling declines, at a time when valuation multiples are not otherworldly by historic standards.
Charles Lister Smith, PhD
July 24, 2026
[1] Authorized in 1960, Real Estate Investment Trusts (REITs) emerged as the principal vehicle for financing the construction industry by 1970, when market yields rose above the limits imposed by Regulation Q that capped deposit rates. Consequently, U.S. households rotated funds into higher-yielding money market instruments, which starved thrift banks of capital traditionally deployed in construction lending. Having increasingly shifted towards a leverage-driven return model, the entities were ultimately exposed to the rise in market yields that commenced in 1973.
[2] “U.S. Orders Dollar Devalued 10 Per Cent,” New York Times, February 13, 1973, 1; “Statement by Secretary Shultz on Devaluation of the Dollar,” New York Times, February 13, 1973, 56.
[3] John H. Allan, “This Crunch Is Different: Loans Cost Plenty, but the Money Is Available,” New York Times, August 12, 1973, 137.
[4] ibid, 143.
[5] This understanding, which stresses supply-demand imbalances when explaining the regime shift in the market for U.S. Government securities, conflicts with the conventional wisdom that upholds the discount rate of the Federal Reserve Banks as the primary, if not only, driver of short-term market yields. Those arguing the latter will explain that the described increase in market yields is attributable, oddly, to investors anticipating future rate increases of the Federal Reserve Board.
[6] Against a total of $23.4 billion owned by foreign entities in March 1973, Japan accounted for $6.0 billion, or 25.5%, while Germany held $11.4 billion, or 49.1% of the segment total. The former were notably marketable and the latter non-marketable (Federal Reserve Board, Federal Reserve Bulletin (June 1973), A81).
[7] Federal Reserve Board, Annual Report for 1973, 69; Clyde H. Farnsworth, “Oil as an Arab Weapon,” New York Times, October 18, 1973, 1.
[8] Bernard Weinraub, “Oil Price Doubled by Big Producers on Persian Gulf,” New York Times, December 24, 1973, 1.
[9] Federal Reserve Board, Federal Reserve Bulletin (December 1974), A68.
[10] This assessment is consistent with Barsky and Kilian (2004), who argue that the major oil price movements of the period were not exogenous to the U.S. macroeconomy and that none of the more recent oil shocks produced stagflation, as well as Campbell and Shiller (1991), who find the postwar term structure inconsistent with the expectations theory of interest rates.
[11] Sam Zell, "Perspectives on the REIT Industry," Address to the NAREIT Annual Convention, New Orleans, 1993. Reprinted in Wharton Real Estate Review, Spring 2012.