
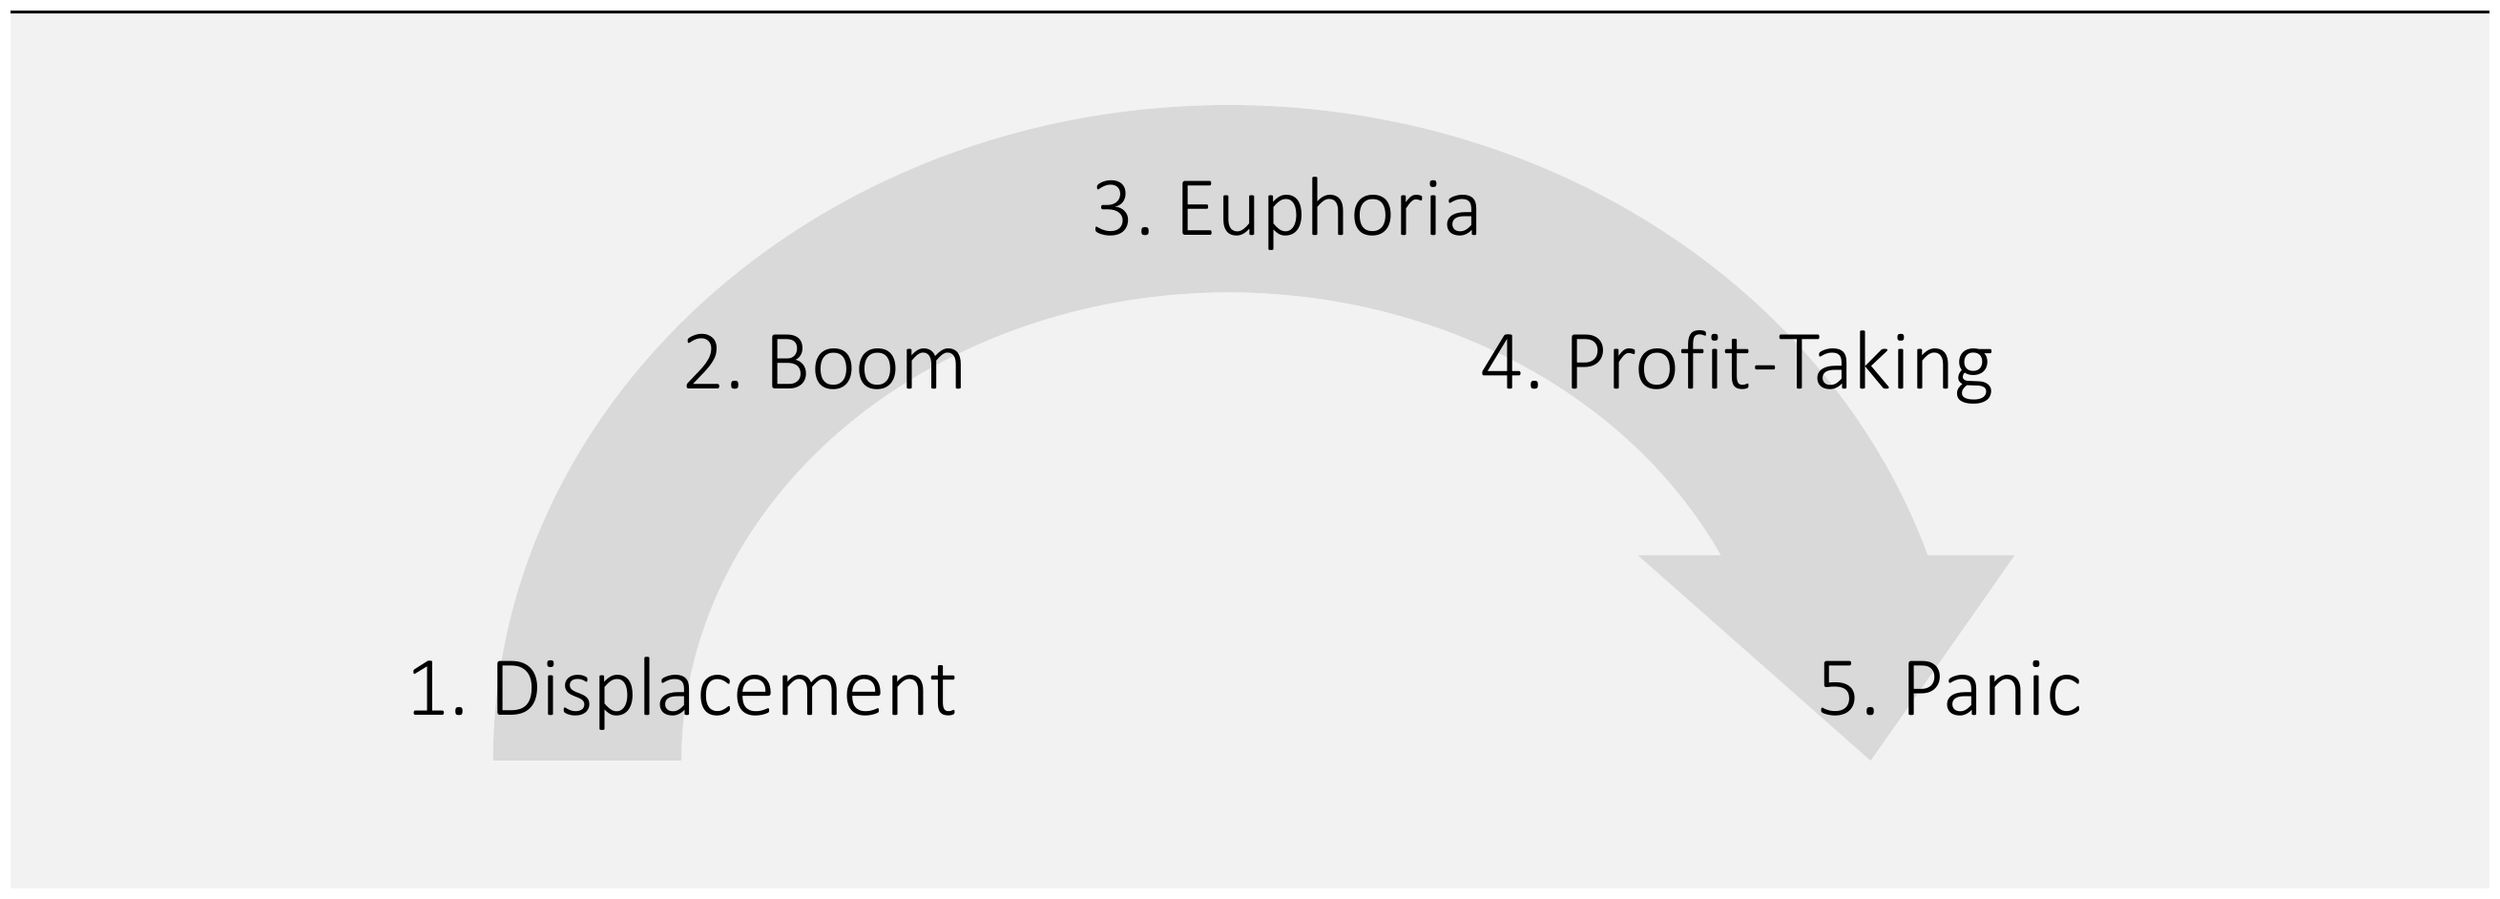
If a speculative bubble is present in the financial markets, how did it start? With the bulk of the scholarly literature on the topic debating the existence of the phenomenon, we are behooved to circumvent the rhetoric by defining a speculative bubble as a decline in a major equity index of more than 40%. History has recorded 17 such instances in the last 350 years. Notwithstanding literature devoted to valuation multiples, which lack any predictive capacity, the only practicable framework for assessing the question is the Kindleberger-Minsky model. Stretching five stages, it begins with displacement, before turning to phases of boom, euphoria, profit-taking, and panic, as shown in Figure 1. What then acted as the displacement mechanism that was responsible for catapulting the marketplace into the current boom?
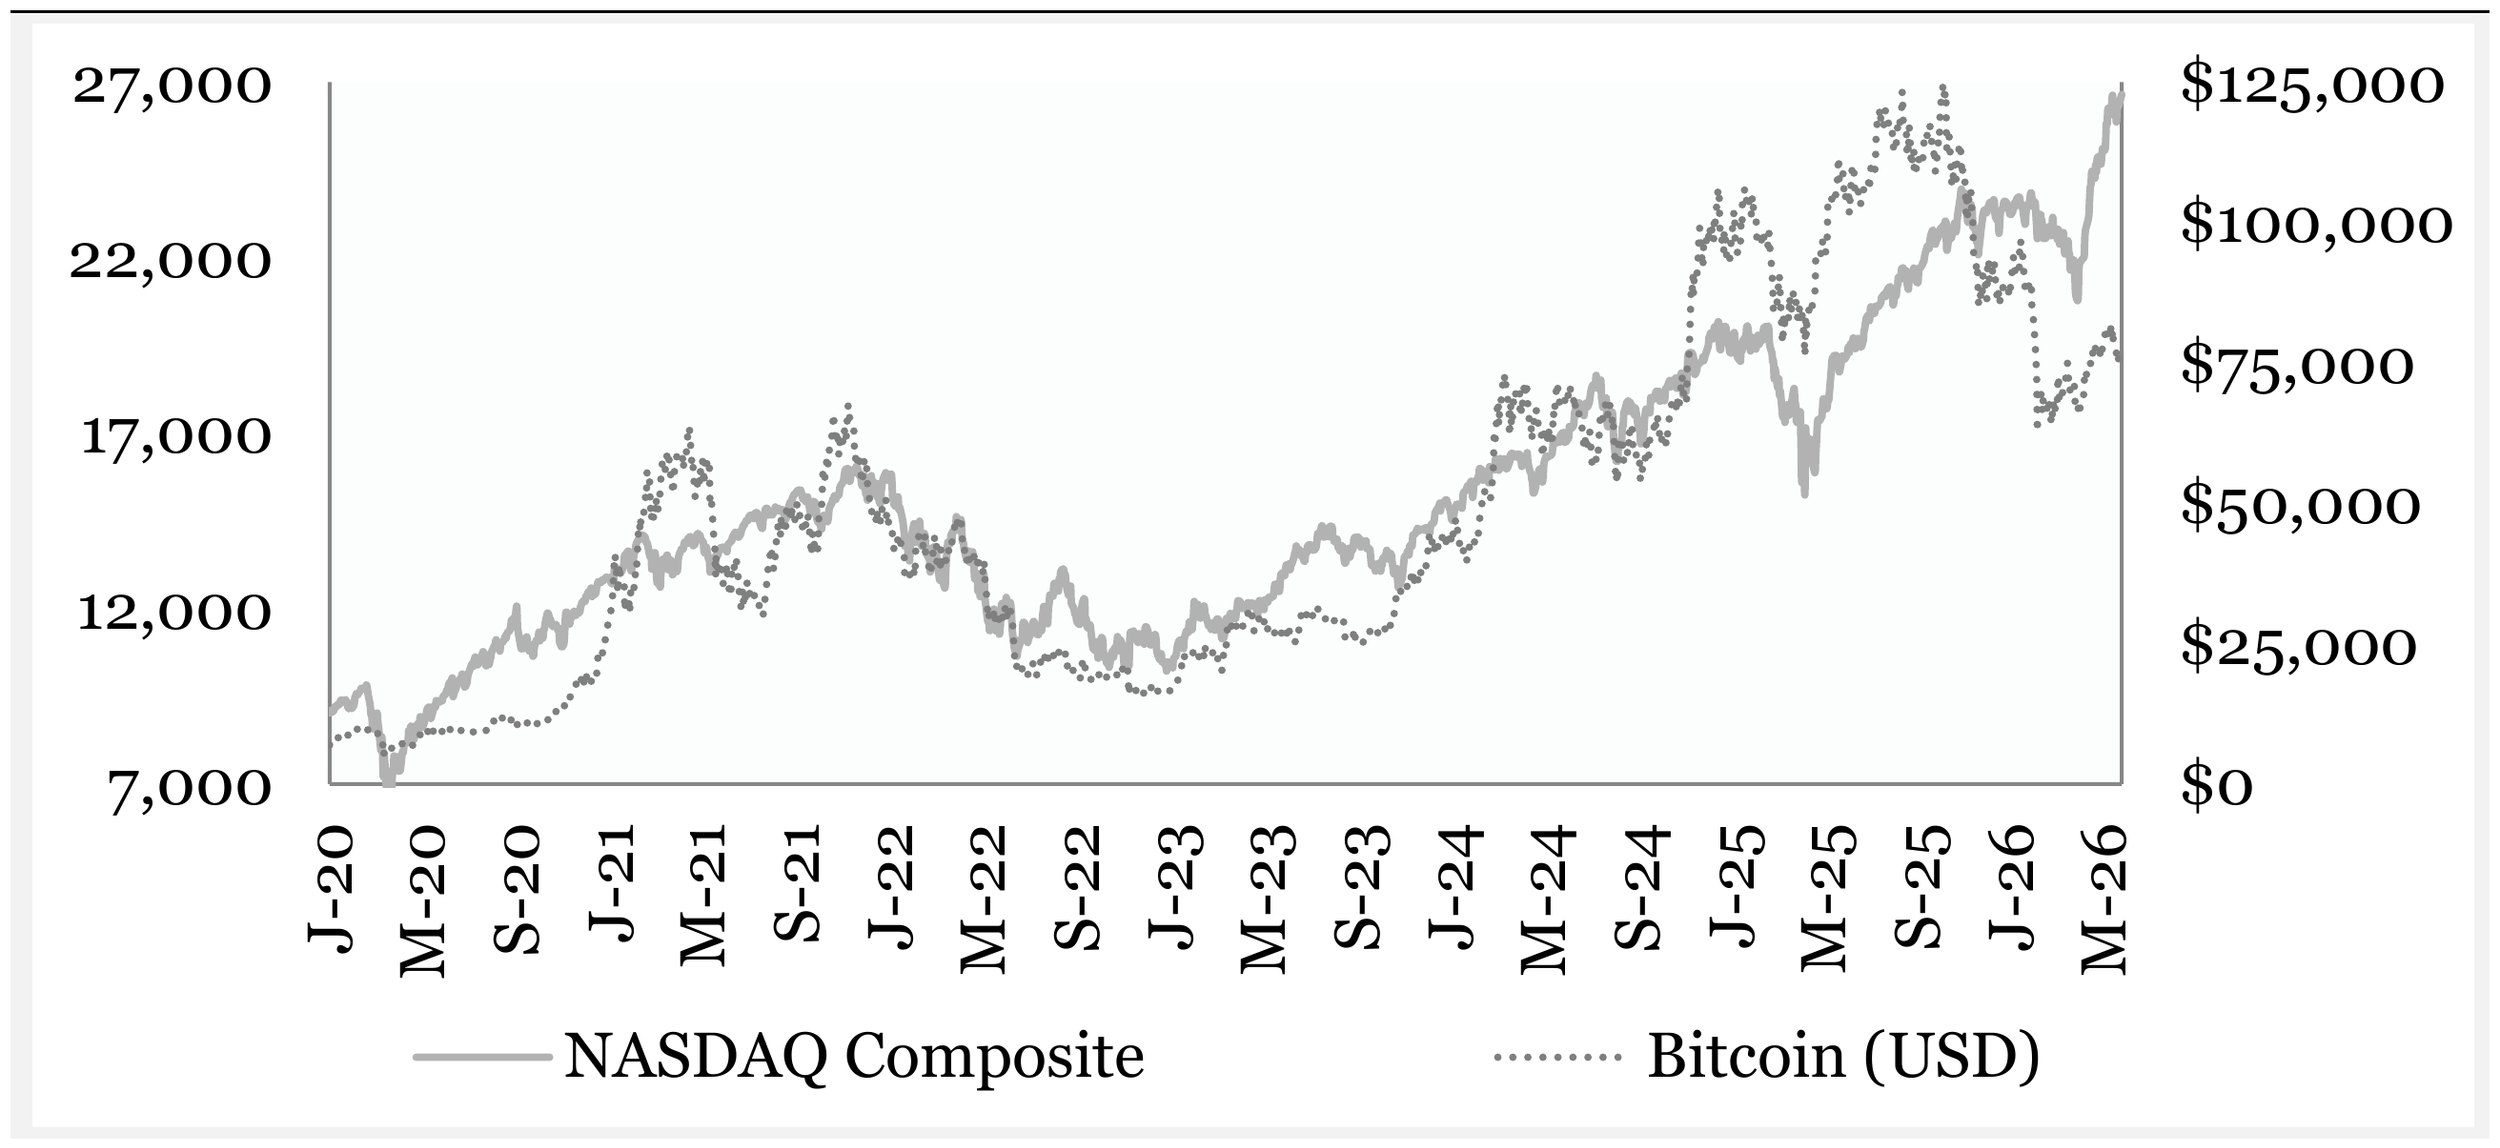
Where Charles Kindleberger (1978, 41) describes displacement as "some sudden advice many times unexpected," it is more useful to define the element as an increase in the amount of investable capital. Invariably, this extension has been derived from an outsized expansion in the money supply (M2), which has been achieved in a myriad of ways, including the refunding of popular war bonds and the accumulation of reserves by central banks. Applied to the present, the startling 27.2% increase in M2 in the year ending November 2021 represents an obvious outlier. Against a comparatively limited number of investment outlets, the influx of funds forced an increase in asset prices, including a 134% rise in the Nasdaq (from 6,861 to 16,057) in the twenty months ending November 2021, when the marketplace was introduced to now-normalized ‘meme stocks’ and cryptocurrencies, including Bitcoin, which climbed by a multiple of 13.5x (from $5,014 to $67,666) in the same period. In keeping with the pattern of 1929, 1989, and 2000, stock prices reached their cyclical highs in sympathy with a peak in IPO volumes in November 2021. Thereafter, the Nasdaq fell 36.4% to 10,213 in the fourteen months ending December 2022, when Bitcoin fell by a remarkable 76.7% to $15,787.
Figure 1. Kindleberger-Minsky Model
Source: Charles Kindleberger (1978).
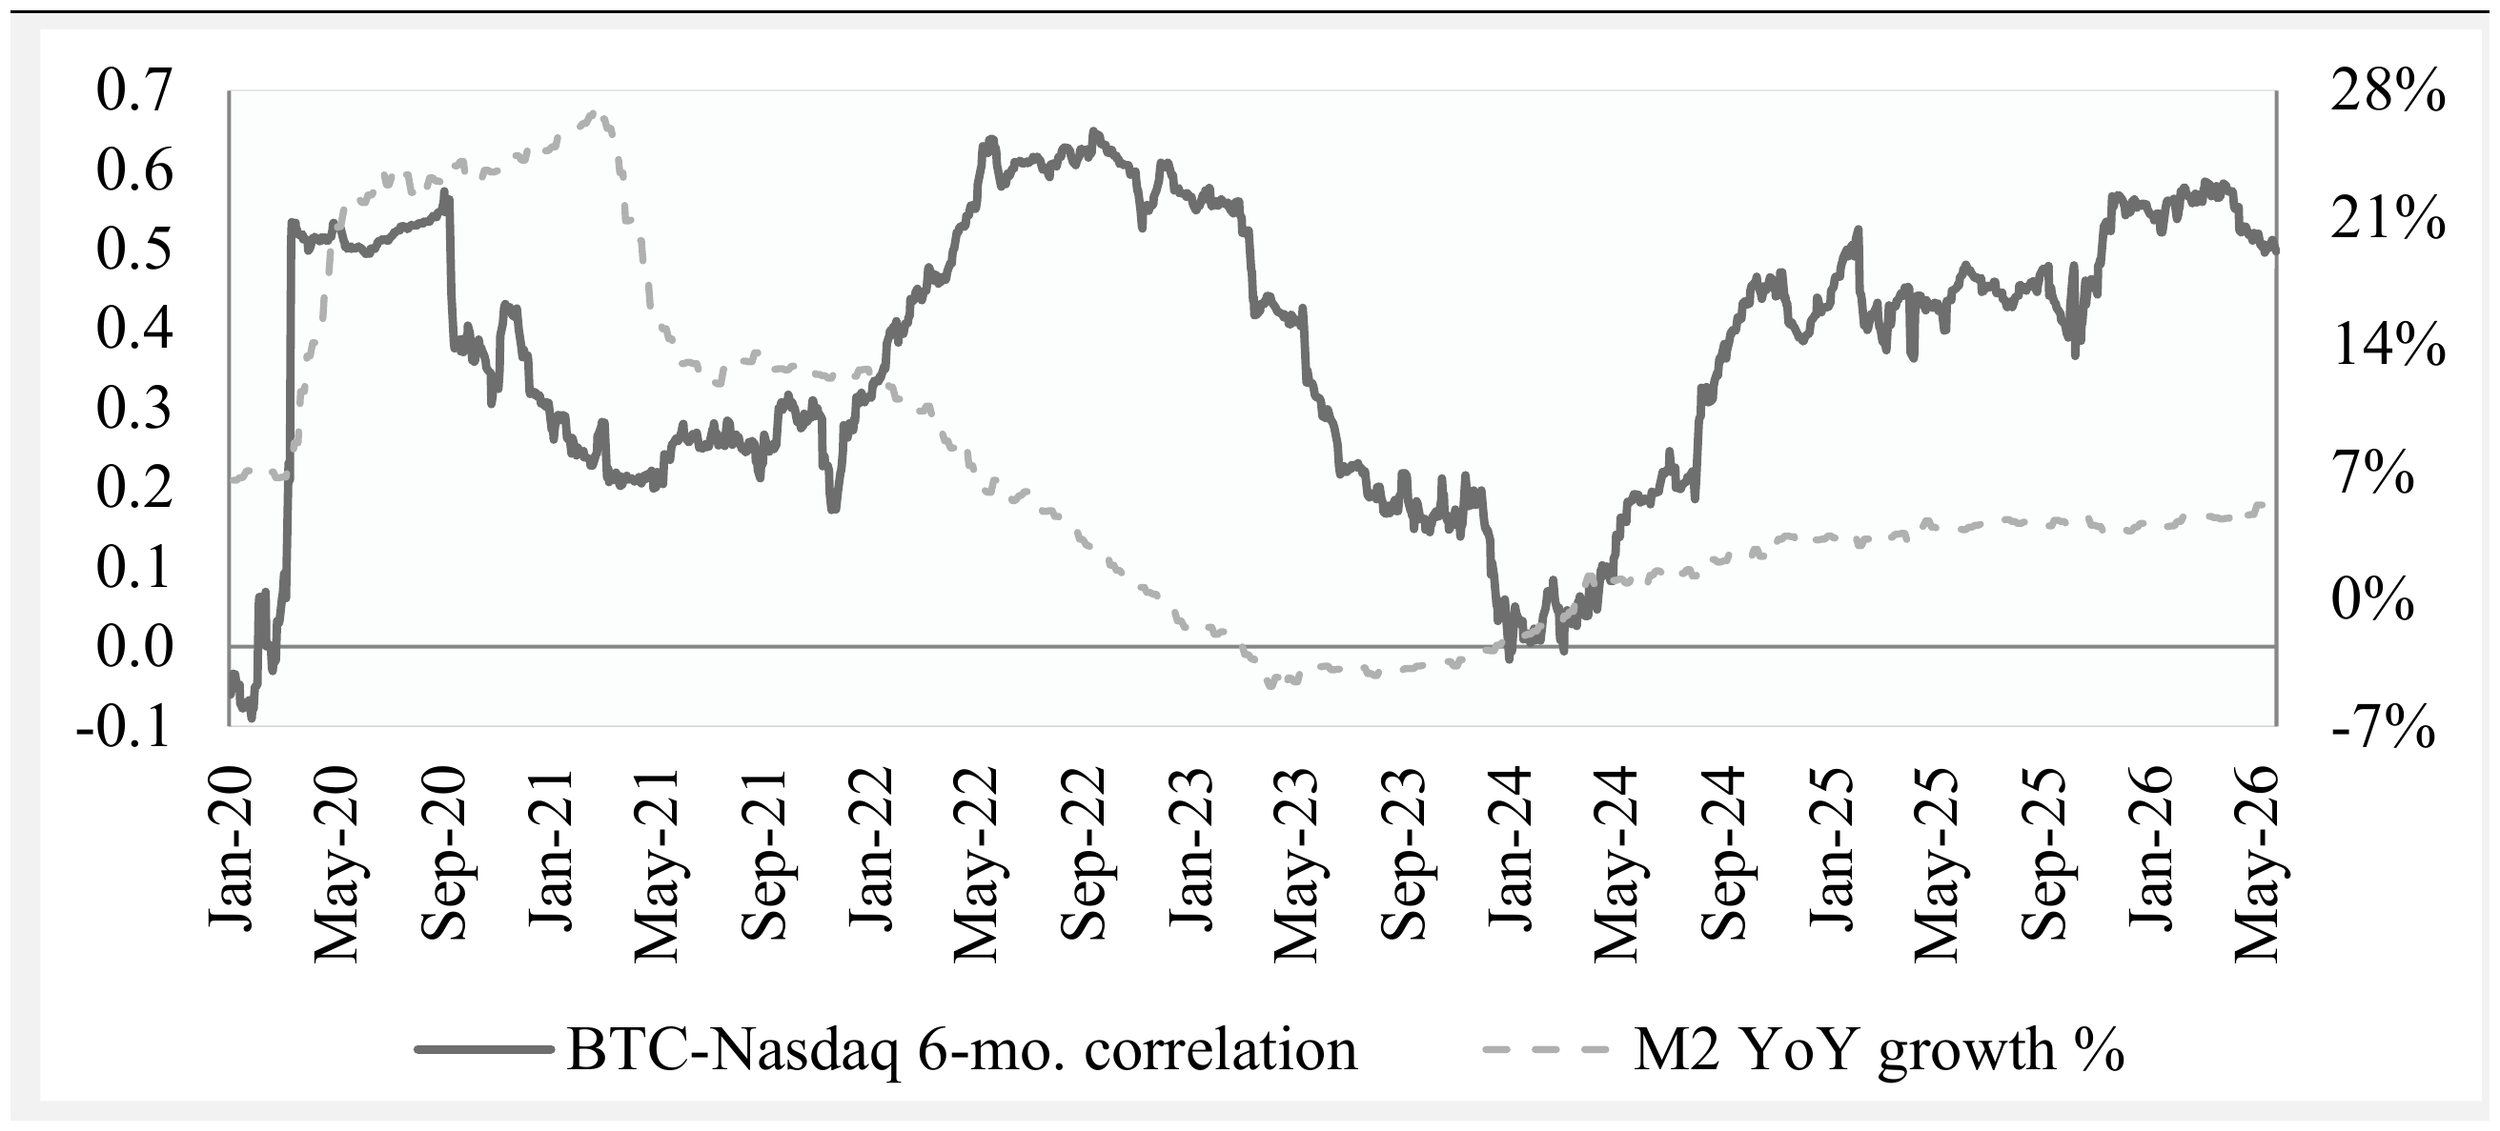
Near-dormant, the speculative craze was resuscitated after the election of President Trump, who was not only recognized as being friendly to business interests but also keen on removing restrictions placed on cryptocurrencies. What followed was a twin price increase in stocks and cryptocurrencies that resurrected the correlation observed in the prior swing. The empirical picture is striking. Per Figure 2, having turned negative at the beginning of 2024 on the back of a decline in M2, the correlation between Bitcoin and the Nasdaq was reversed in the ensuing period, rising to 0.471 in November after the election of President Trump.
In turn, the relationship weakened to 0.366 in the initial ten months of 2025, but only on account of the meteoric gains in Bitcoin, which had risen by 64.9% (from $75,639 to $124,753) in the prior 12 months at more than double the rate of the Nasdaq. In connection with the outsized margin call that caused the liquidation of $19 billion of Bitcoin on October 10, it will be observed that the correlation jumped by 202-bps (to 0.568) in the ensuing seven weeks, when the corresponding decline in the Nasdaq was unexplained outside of the composite’s correlation to cryptocurrencies. Rising to a peak of 0.583 at the end of March 2026, the price of bitcoin stabilized above $70,000 within a fortnight, when stock prices reasserted their upward trend, softening the correlation of the variables at hand.[1]
Figure 2. Correlation of Bitcoin-Nasdaq vs. Growth in Money Supply
Source: Federal Reserve Bank of St. Louis.
When compared to the prior period, the correlation observed between the Nasdaq and Bitcoin in the present movement is unusual for two reasons. Firstly, the growth in M2 that fused the variables in 2020 has not been present in the current upswing. This means the unifying agent between variables must be attributed to other factors. Secondly, in anticipation of legislation proposed by the Trump Administration, cryptocurrency pioneers like Robinhood, Tether, and Cantor Fitzgerald introduced margin products that allowed Bitcoin to be pledged as collateral at increasing rates during 2025.[2] Moreover, having been followed by the likes of JPMorgan and Morgan Stanley, these decisions have expanded the amount of investible capital in a manner that can only augment the correlation between stocks and cryptocurrencies.[3] Put differently, the impact of a growth in M2 is nearly interchangeable with the sudden acceptance of a new security as collateral.
Figure 3. NASDAQ Composite vs. Bitcoin
Source: Federal Reserve Bank of St. Louis.
Together, one is left then with the uncomfortable implication that stock values have been propped higher by the activation of cryptocurrency as collateral. For those in doubt, one need only consider the example of a household with $1 million of Bitcoin that was suddenly allowed to draw down 80% of the total. Is it possible that a meaningful number of Bitcoin holders did not take this option? Absent any other explanation, the path of stock prices during the last year forces the assumption. The notion suggests the presence of an underappreciated risk with strong parallels to the boom period that preceded the Great Crash (1929), when unlisted stocks were, for the first and only time, accepted as collateral for margin loans. Ultimately, unlisted stocks accounted for 22% of all security loans extended by commercial banks and 38% of those situated outside of New York in 1929.[4] When the Great Crash struck, these securities became unsalable, instilling a variant of Gresham’s Law that forced the sale of Blue-Chip stocks at extraordinary lows.[5]
Should the forthcoming meltdown mirror those of the past – and the newly issued securities with the lowest intrinsic value fall furthest – the leverage built upon cryptocurrencies will work in reverse in much the same manner as unlisted stocks of the late 1920s. Indeed, recognizing the displacement mechanism at hand, one struggles to arrive at any other conclusion.
- Charles Lister Smith, PhD
June 8, 2026
[1] For reference, from the beginning of 2025 to the present, the 30-day correlation is highest when Bitcoin trades between $50,000 and $70,000, at 0.61. With respect to SOFR and tri-party repo spreads, it is higher when funding is stressed, at 0.50, than on calmer days, at 0.44. It is also unchanged on a rank basis in the same period, as demonstrated by a Spearman coefficient of 0.45 and a Pearson coefficient of 0.46, which indicate the relationship does not rest on outlier events like October 10. Lastly, using a Forbes-Rigobon adjustment, the co-movement holds in calm conditions, at 0.42, which confirms the correlation is not an artifact of volatility in the period.
[2] “Robinhood Begun Rolling Out Futures Trading,” Finance Magnates, January 30, 2025; “Robinhood Launches Stock Tokens, Reveals Layer 2 Blockchain, and Expands Crypto Suite,” Robinhood Newsroom, June 30, 2025; “Tether Invests in Crypto Credit Platform Ledn,” Stocktwits, November 18, 2025; “Wall Street’s Cantor Fitzgerald to Open Bitcoin Financing, Lending Business,” CoinDesk, July 27, 2024; “Cantor Debuts $2B Bitcoin Lending Business,” CoinDesk, May 27, 2025.
[3] “JPMorgan to Let Institutional Clients Pledge BTC and ETH as Loan Collateral by Year-End,” The Block, October 24, 2025. “Morgan Stanley’s E*TRADE to Add Crypto Trading in Early 2026,” Reuters, September 23, 2025.
[4] U.S. Senate, Hearings Before a Subcommittee of the Committee on Banking and Currency, Pursuant to S. Res. 71 (1931), 1014.
[5] Smith, Charles Lister, The Great Crash Revisited: Undigested Securities and the Origins of the Panic (February 2026), 20. https://ssrn.com/abstract=6298378 or http://dx.doi.org/10.2139/ssrn.6298378.