
The Japanese Asset Bubble was precipitated by the Plaza Accord (1985), which forced an aggressive devaluation of the U.S. dollar and, in turn, an accommodative monetary policy upon the Bank of Japan. From September 1985, the money supply grew by 52 percent (from ¥300 trillion) to ¥456 trillion in the period to December 1989. Initially, this monetary expansion was felt strongest in land values that surged threefold in as many years (from ¥176 trillion) to ¥529 trillion in 1988. Per Figure 1, the center of speculation thereafter was fixed on stocks, which gained in value from ¥169 trillion in 1985 to ¥527 trillion in 1989, when Japan accounted for 44 percent of the world’s stock market capitalization. Meanwhile, the three-quarters of a square mile encompassing the Emperor’s Palace in Tokyo was valued higher than all of California.[1] Justified on the basis that cross-holdings distorted the total, the P/E multiples of Japanese stocks soared from 17.9x in 1980 to 29.4x in 1985, before leaping to 58.6x in 1986 and 53.7x in 1989.[2]
Figure 1. Value of Land and Stocks in Japan
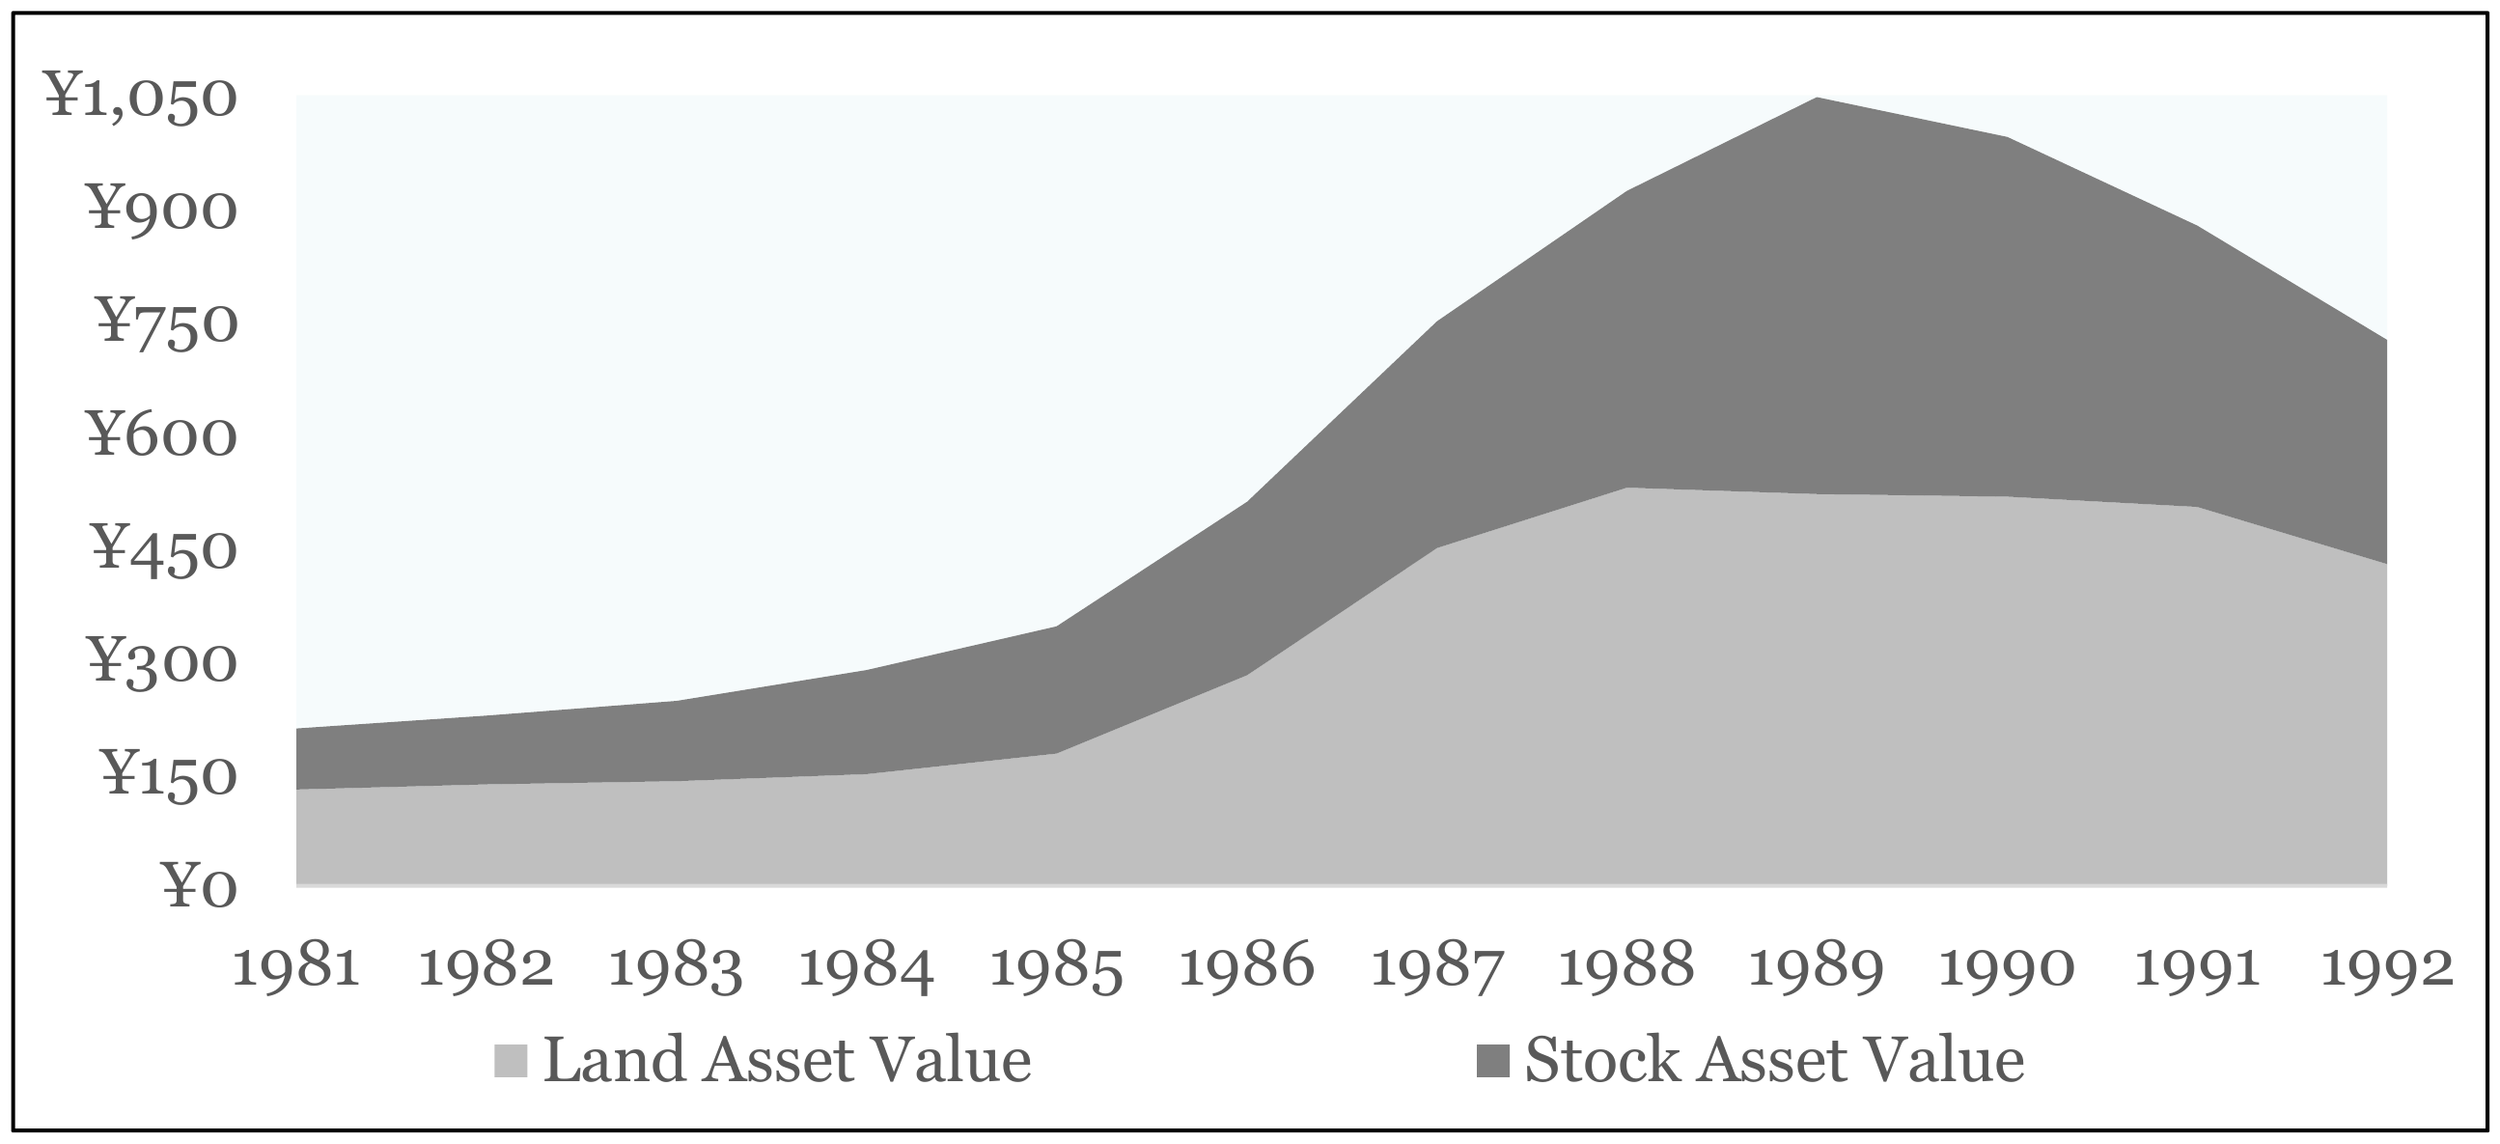
Source: Yukio Noguchi, "The 'Bubble' and Economic Policies in the 1980s," Journal of Japanese Studies, vol. 20, no.2 (1994), p. 294. Figures in trillions of Japanese yen.
The gyration in asset values in Japan was intimately connected with a boom in equity-linked corporate issues in the three years ending in 1989, when the offerings were largely made on the Eurobond market. Occupying a combined 89% of all fixed income offerings, these included convertible bonds of ¥22 trillion (see Figure 2) as well as bonds with warrants of ¥17 trillion that were, relatedly, associated with a further ¥4.6 trillion of exercised stock in the period. Tall figures, the outstanding convertible bonds and warrants represented 18.2 billion in shares in May 1989 that, if fully converted, denoted 7.1 percent of the stock of 977 issuers and 5.8 percent of all listed shares in Japan.[3] Comparatively, new stock issues rose sharply from ¥400 billion in 1986 to ¥5.8 trillion in 1989. Of the latter, a startling ¥3.0 trillion fell in the last two months of 1989, when the Nikkei reached its cyclical peak as shown in Figure 3.
Figure 2. New Corporate Issues in Japan
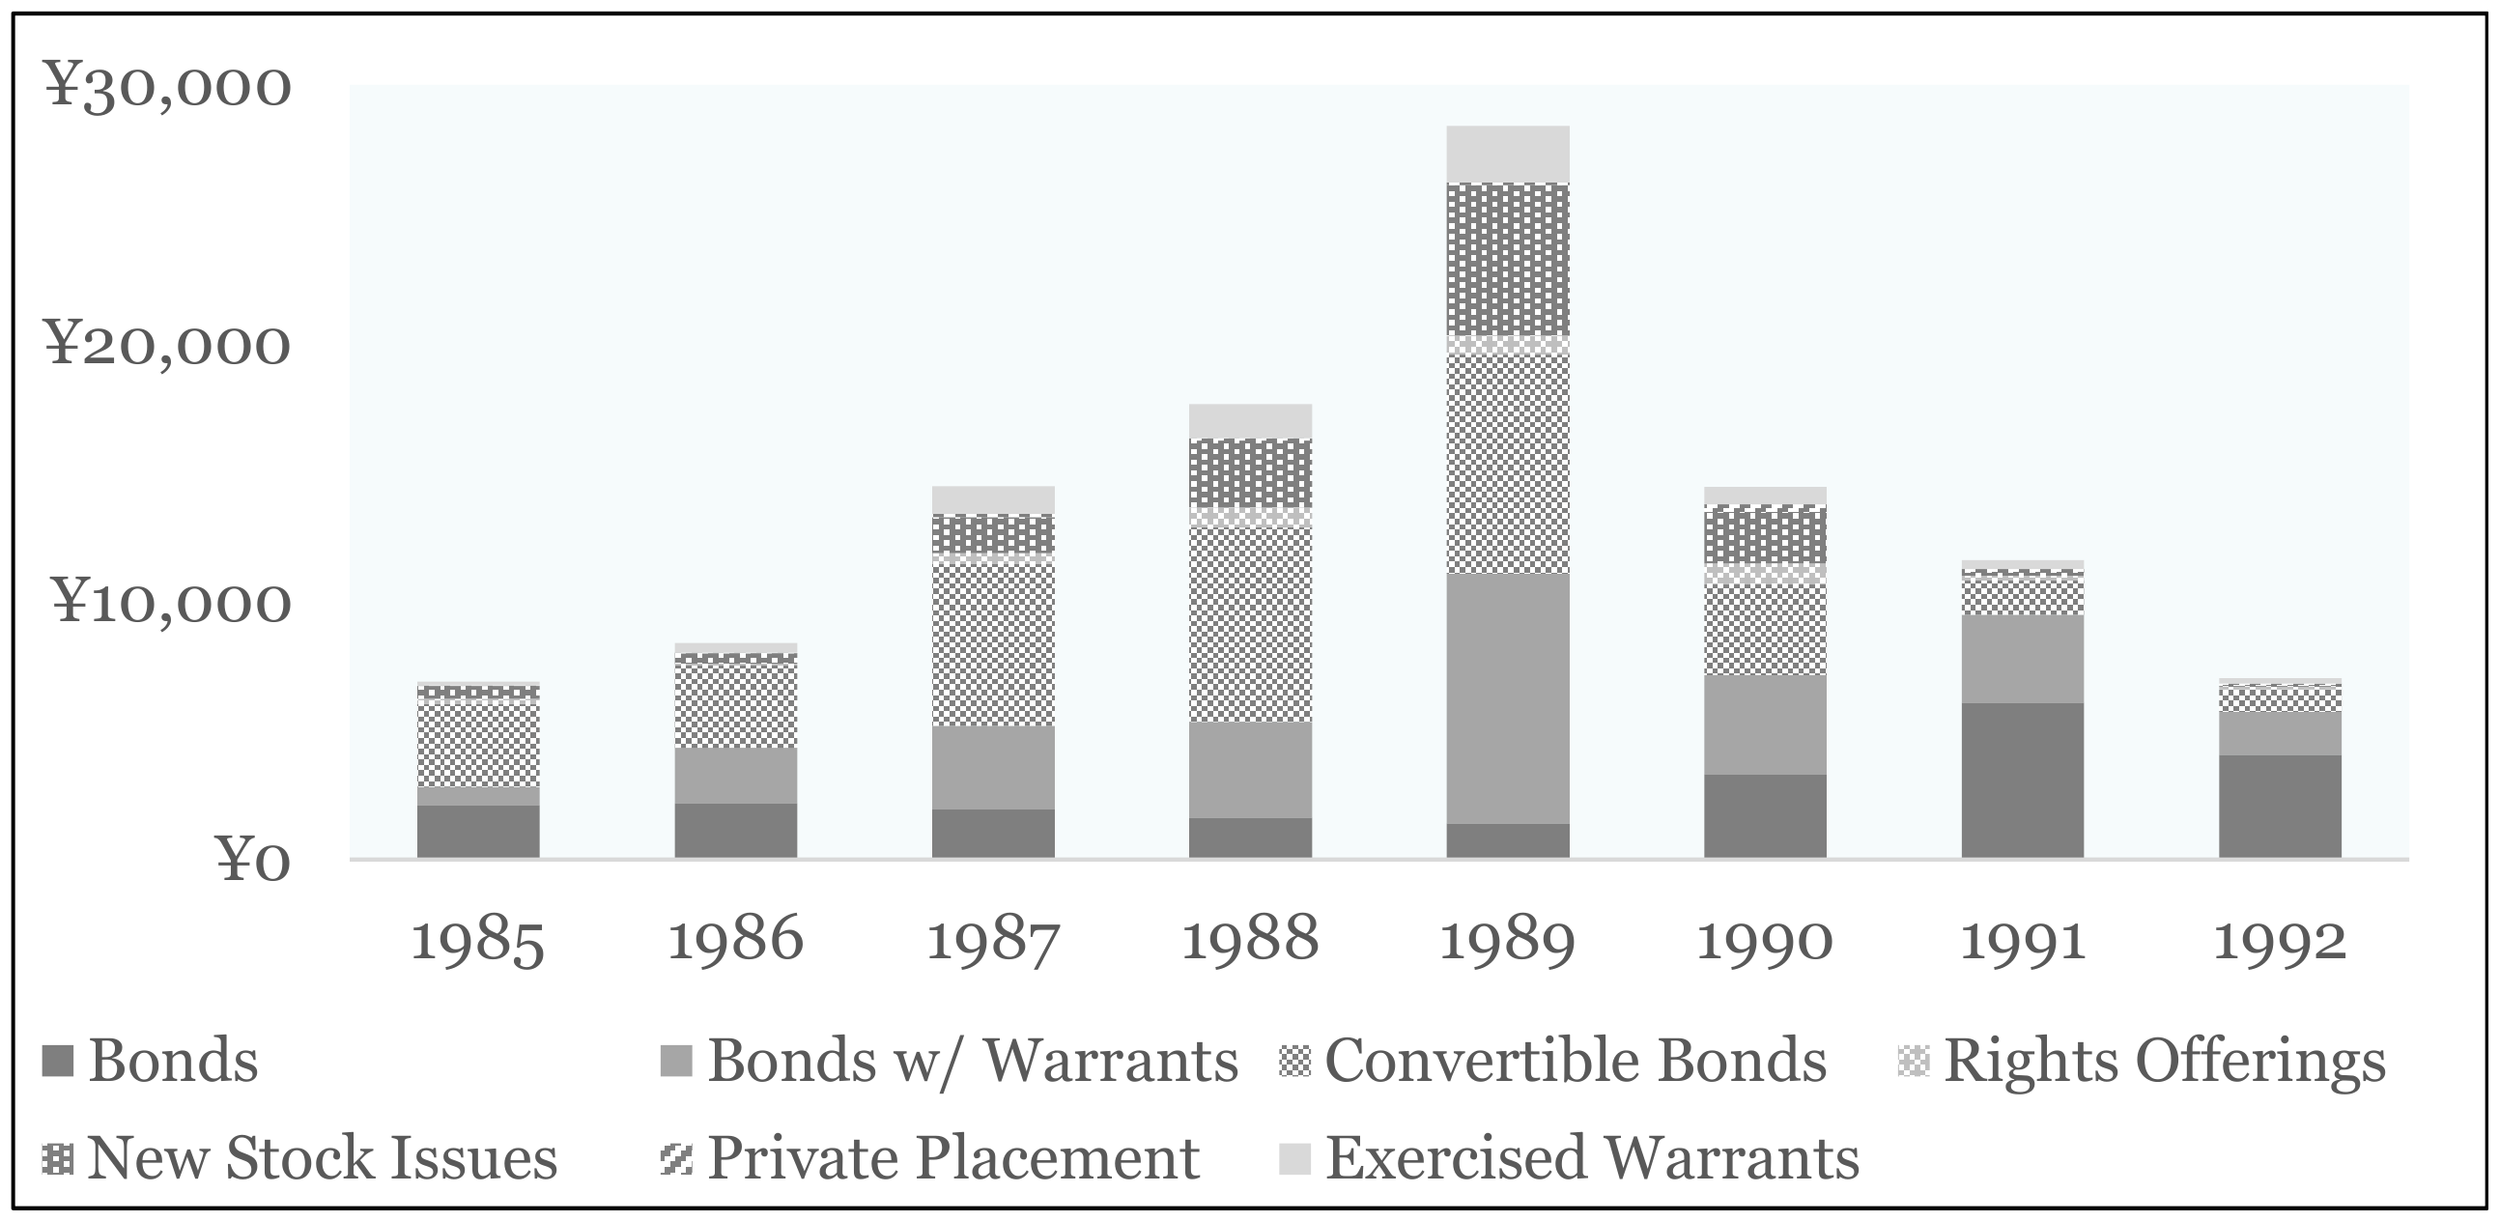
Source: OECD, Economic Surveys: Japan (1993). Figures in billions of Japanese yen.
Rather than flowing into capital expenditures, the proceeds from these offerings were utilized to acquire other securities. Between 1987 and 1989, the financial assets of nonfinancial corporations rose an astonishing ¥152 trillion.[4] These purchases intensified the extensive cross-holdings among Japanese corporations that, strikingly, held 72.8 percent of all outstanding equity in 1987, when financial institutions accounted for 42.2 percent of the total. By comparison, only 23.6% of the total was attributable to individuals, who increasingly gravitated towards investment trusts, which grew eightfold between 1981 and 1989 to reach ¥57 trillion.[5]
Figure 3. Nikkei vs. New Stock Issues
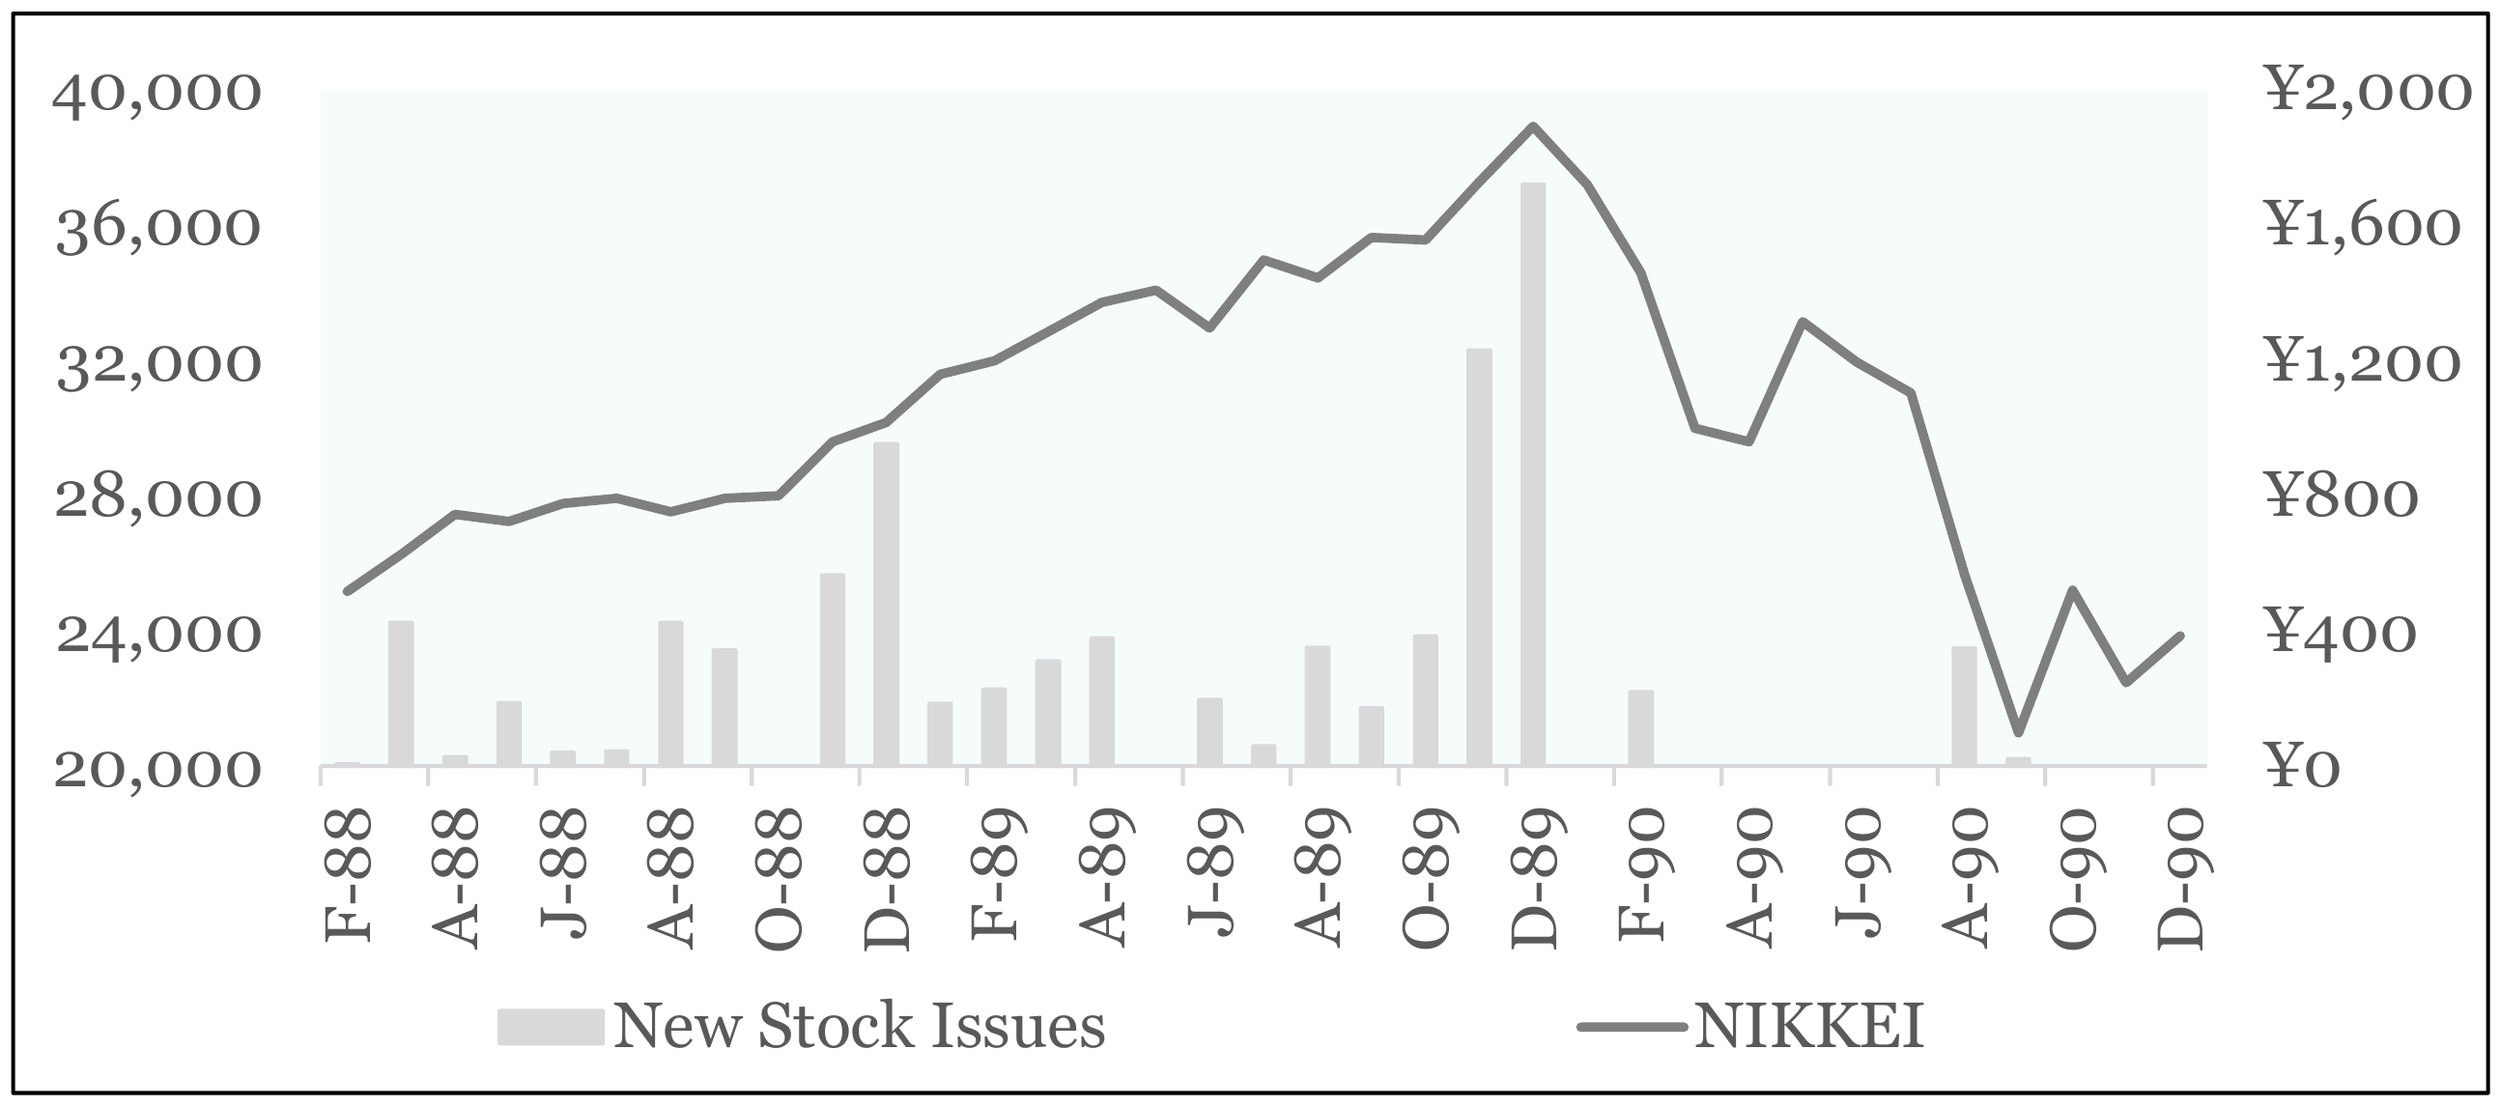
Source: Federal Reserve Bank of St. Louis; Bloomberg. Figures in billions of Japanese yen.
Set in motion in January 1990, the downturn in the Nikkei occurred amidst a monetary tightening that saw the Bank of Japan (BOJ) lift its official discount rate (from 2.50 percent) to 3.25 percent in May 1989 before a further 150-bps increase in the six months beginning October 1989. Curiously, instead of strengthening the yen vis-à-vis the U.S. dollar, the exchange rate weakened in response to the monetary action, falling 20.4 percent (from 132.85 to 159.90) in the twelve months ending April 1990. This implied exodus of funds – both foreign and domestic – is reflective of a step-down in trading volumes that defined the cataclysm. To borrow from one Tokyo-based fund manager: “There is no panic selling. In fact, there has been very little selling.”[6] Thus, where comparable stock market crashes all hinged on outsized trading volumes, the same impulse was absent in Japan, where daily volumes averaged roughly 500 million shares, or half the rate observed in the prior two years, in the initial two months of 1990, when the Nikkei declined 11.1 percent (from 38,916) to 34,592.[7] Drifting lower still, the index stood at 20,222 on October 1, marking a 48 percent fall in nine months' time.
While the BOJ has been accused of pricking the asset bubble, the fact remains that the step-down in trading volumes reflects an exhaustion of funds in Japan. Moreover, the oversupply of offshore call warrants, which had swelled to an estimated $49.7 billion from $0.4 billion four years prior, was adeptly utilized by U.S. investment banks as a basis to underwrite a phalanx of Nikkei warrant puts that were rolled out en masse during January 1990, when futures volumes suddenly surged to three times that of the cash market.[8] While dismissed elsewhere, this swing indicates a shift in price discovery (from the cash) to the futures markets, which is supportive of claims made by Japan’s Ministry of Finance, where the put warrants were blamed for having “some effect” on the decline in stock prices.[9] To quote officials: “We don’t say that futures caused the decline, but when there is low turnover in the cash market, index arbitrage means larger price falls.”[10] In turn, this opinion informed the Tokyo Stock Exchange, which instituted a “warrant moratorium” in April 1990, which suggests the concerns were not entirely misplaced.[11]
Notwithstanding the demographic constraints in Japan, where the working age population peaked in unison with the price bubble, and the blatant market manipulation carried out by the ‘Big Four’ bank institutions, where the chief executives all resigned in disgrace, the evidence suggests the market collapse occurred when funds were exhausted. Indeed, so great was the overextension that a not inconsiderable portion of the demand for call warrants was from investors looking to bet against the Nikkei, a signal that the overhang had become the ‘tail wagging the dog.’[12] Moreover, in August 1991, The Economist was still warning of “factors on the supply side” that threatened to unload an additional ¥24 trillion into the marketplace.[13] Looking forward, one sees an overhang of comparable mite in the U.S. markets. If history provides us with a lens into future events, one can anticipate a similar freefall at the point when the marginal buyer is fully spent.
- Charles Lister Smith, PhD
June 25, 2026
[1] Douglas Stone and William T. Ziemba, “Land and Stock Prices in Japan,” Journal of Economic Perspectives, vol. 7, no. 3 (1993), 149.
[2] French and Poterba adjust for cross-holdings by discounting the P/E multiple by a factor of 0.663, which reduces the figure to 35.6x in 1989 (French, Kenneth R. and James M. Poterba. "Were Japanese Stock Prices Too High?" Journal of Financial Economics, vol. 29 (1991), 348).
[3] Robert Zielinski and Nigel Holloway, Unequal Equities: Power and Risk in Japan’s Stock Market, Kodansha International Ltd., 1991, 165.
[4] This figure includes tokkin trusts that were managed for corporations by banks, which grew from ¥12 trillion in 1986 to ¥43 trillion in 1990 (Yukio Noguchi, "The 'Bubble' and Economic Policies in the 1980s," Journal of Japanese Studies, vol. 20, no.2 (1994), 294; Zielinski and Holloway, Unequal Equities, 131).
[5] The ‘lack of saver choice’ is in part attributable to the size of the minimum trade order that, at 1,000 shares, is out of reach for most investors. Assuming the average share price in 1989 of ¥1,867/share, Zielinski and Holloway observe that a single transaction of 1,000 shares equated to approximately three months of wages for the average office worker. Moreover, only fifteen firms were licensed to market investment trusts in Japan in 1990, when three-fourths of the sector was controlled by the affiliates of Nomura, Daiwa, Nikko, and Yamaichi (Zielinski and Holloway, Unequal Equities, 52-53; Shinji Takagi, “The Japanese Equity Market,” Journal of Banking and Finance, vol. 13 (1989), 558).
[6] M. Brauchli and M. Sesit, “Nikkei Nose-Dives,” Wall Street Journal, February 26, 1990, A1.
[7] Ibid.
[8] Launched first by Bankers Trust on the Toronto Stock Exchange in February 1989, Nikkei warrant puts were subsequently issued by Goldman Sachs & Co. and Salomon Brothers on the American Stock Exchange (AMEX) on January 12, before Merrill Lynch and Morgan Stanley followed suit in the same month (John Dorfman, “Wall Street Is Placing Bets Tokyo’s Market Will Fall,” Wall Street Journal, January 24, 1990, C1; “Trilon To Issue Warrants For Bears on Tokyo Stocks,” Wall Street Journal, February 5, 1990, C12; Henry Sender, “The Tokyo Stock Market Turned Topsy-Turvy,” Institutional Investor (February 1991), 104; Jason Z. Wei, 'Empirical Tests of the Pricing of Nikkei Put Warrants,' The Financial Review, Vol. 30, No. 2 (May 1995), 23.
[9] C. Smith and K. Dunn, “Tokyo Exchange Pushes to Halt U.S. Sales of Nikkei Warrants,” Wall Street Journal, April 26, 1990, C1.
[10] Ibid.
[11] Against the roughly six warrant issues traded in the U.S. in April 1990, up to 25 warrant issues, albeit much smaller, had been offered in Europe in the prior two years (M. Brauchli and M. Kanabayashi. "Japan Bid to Rein in Warrants Market Annoys Brokers." Wall Street Journal, December 12, 1989, 1; Henry Sender, “The Tokyo Stock Market Turned Topsy-Turvy,” Institutional Investor (February 1991), 104).
[12] By April 1990, Nikkei puts warrants accounted for an estimated 40 percent of volumes of the AMEX. Meanwhile, privately placed puts from the same institutions were estimated at sums ten times the listed volumes of Nikkei warrant puts (B. Donnelly and M. Sesit, "U.S. Bears' Bets May Roil Japan's Turmoil." Wall Street Journal, April 17, 1990, C1).
[13] “Japan’s Staggering Stock Market,” The Economist, vol. 320, no. 7720 (August 17, 1991), 71.