
Fueled in part by a surge in foreign inflows, the Dotcom Bubble featured an unprecedented rise in the Nasdaq, which gained 367.2 percent (from 1,081) to 5,049 in the four years ending March 2000.[1] While closely associated with the internet, which was formally commercialized after April 1995 with the dissolution of the National Science Foundation Network, the boom was also felt in the telecom sector, where equipment providers were responsible for building out the underlying infrastructure of the internet, and operator consolidation was accelerated by the Telecommunications Act (1996).[2]
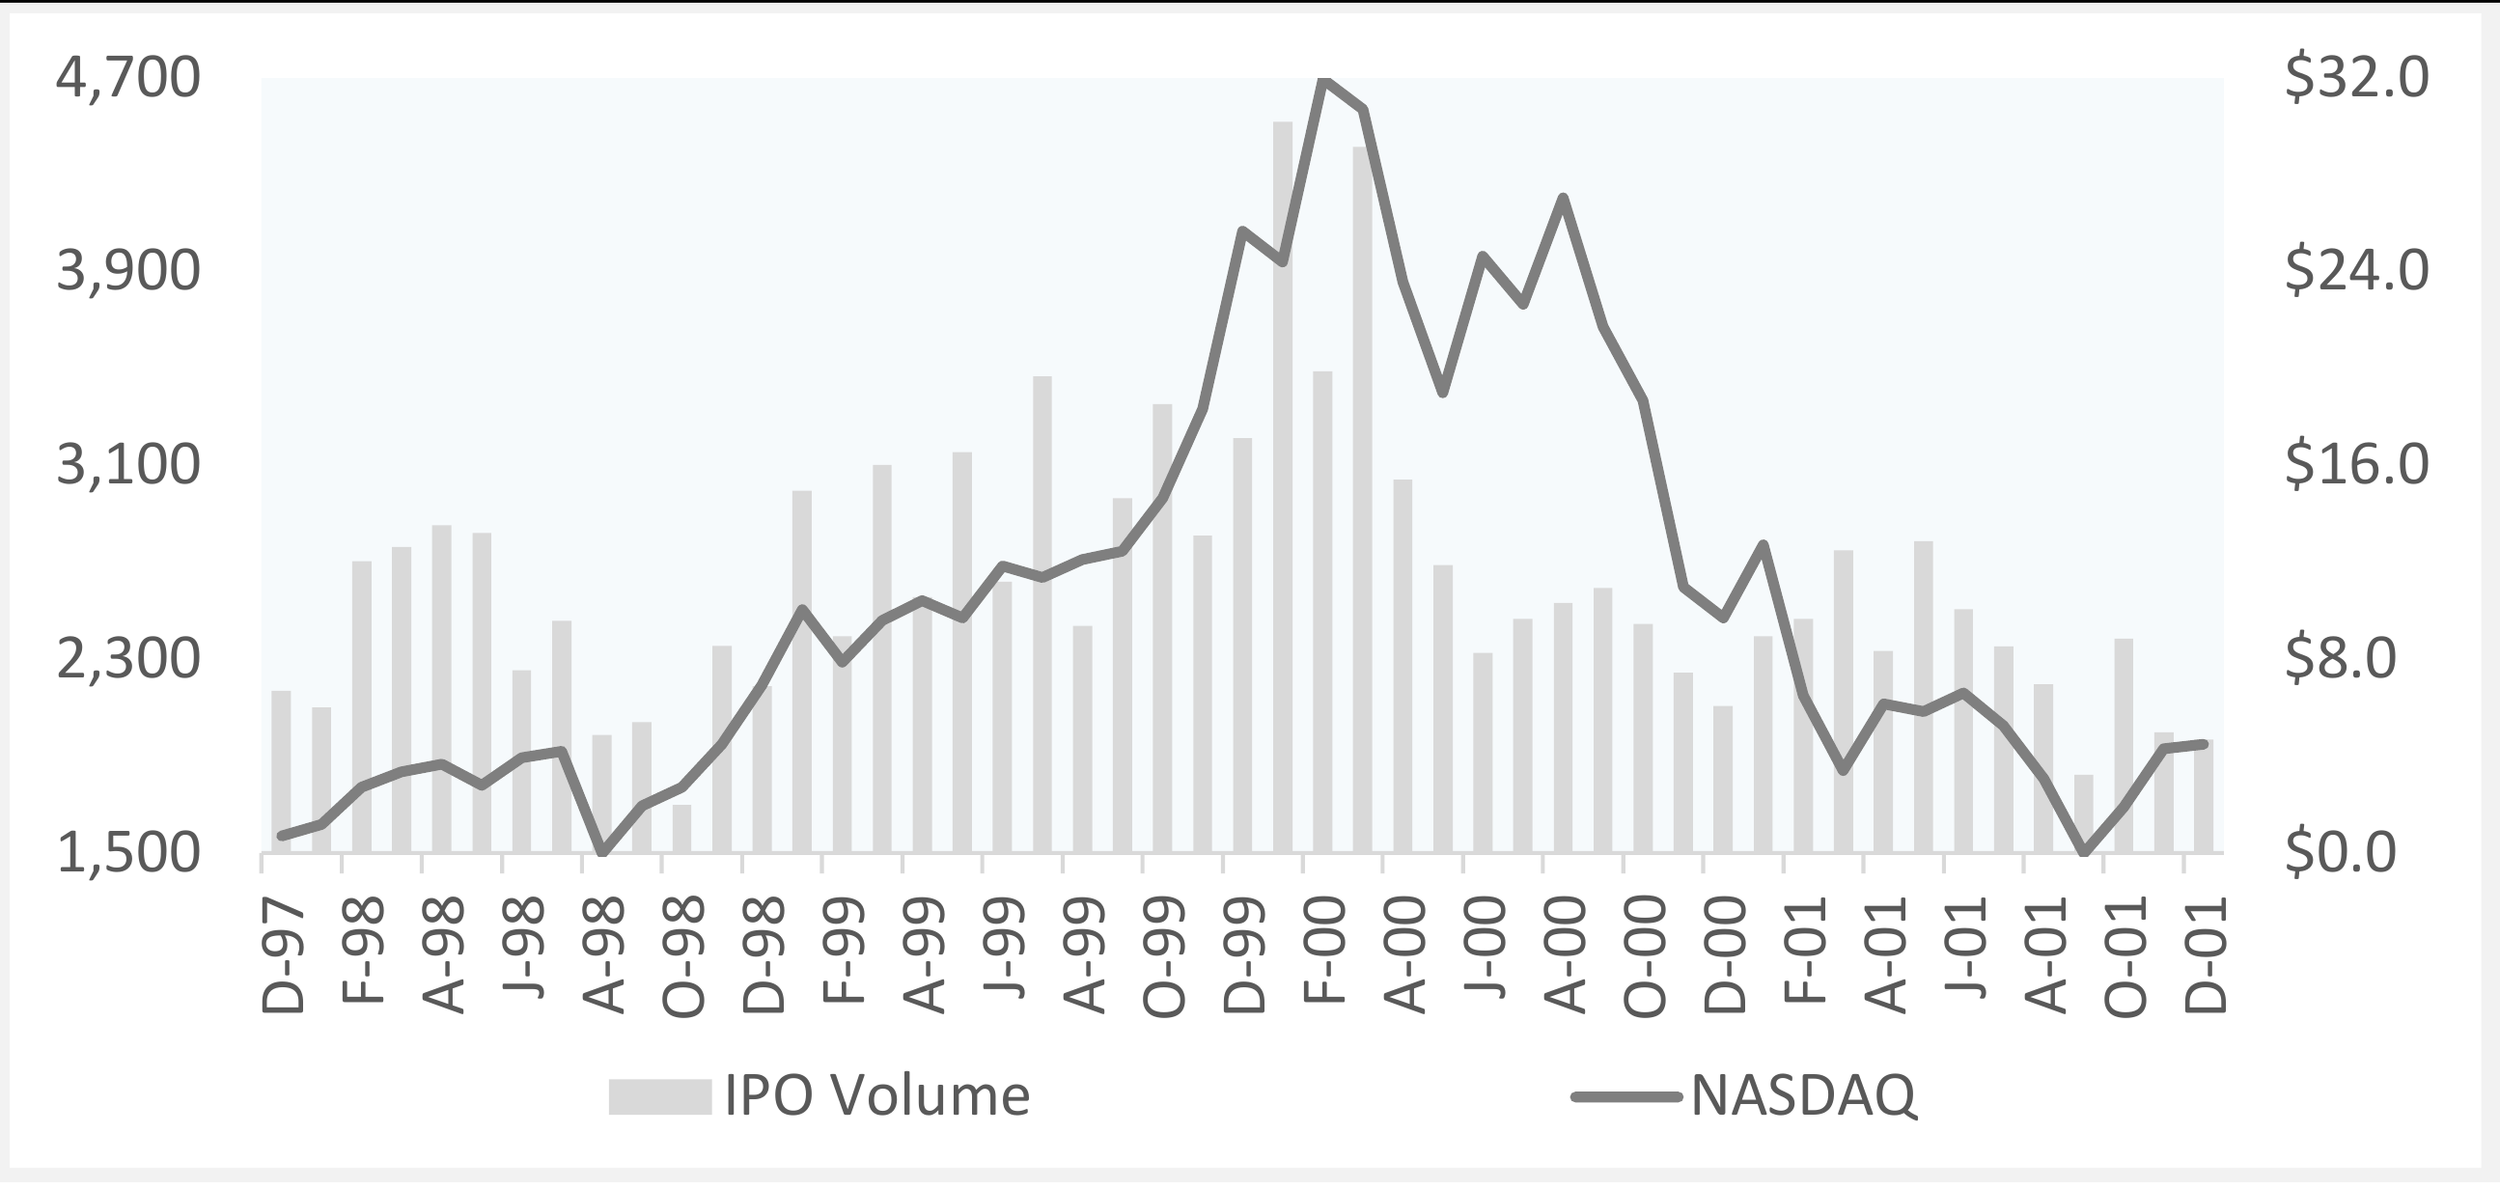
With over 50 percent of households already directly invested, stock participation was deepened during the boom by the rollout of online trading platforms like Charles Schwab, E-Trade Group, and Ameritrade, which provided individuals with hitherto unknown levels of margin debt.[3] Mirroring the growth in share prices was a proliferation of IPOs. Totaling $107 billion in 1997 and $102 billion in 1998, IPO volumes surged to $171 billion in 1999, when the step-up was centered on technology stocks.[4] At the outset of 2000, activity in the financial markets only intensified. Per Figure 1, IPO volumes reached record sums in each of the first three months of 2000, before falling in step with stock prices. In conjunction, marking the peak of the bubble, Time Warner was acquired by AOL for $147 billion of stock and the assumption of debt in January 2000.[5]
From its peak of 5,049 in March 2000, the Nasdaq dropped 37.3 percent (to 3,165) in just eleven weeks, when the slide was uninformed by earnings.[6] Instead, the descent aligns (only) with a series of negative headlines, beginning with an accounting restatement from MicroStrategy Inc. that caused a 62 percent decline in its share price on March 20.[7] Concurrently, Barron’s profiled a widely-circulated study from Pegasus Research International that estimated 51 internet companies (of 207) would burn through their cash in the following 12 months.[8] More meaningfully, the downward movement in stock prices was influenced by the supply of shares held under lock-up agreements, which typically prevented insiders from selling their holdings for 180-days after the IPO date. As a result, the reduced public float of shares led to initial price gains that were overcome by the shadow supply of shares held under lock-up that peaked the moment the convulsion took hold.[9] As it was, between November 1999 and April 2000, the volume of shares unlocked grew from $70 billion to $270 billion.[10]
Figure 1. IPO Stock Volumes vs. NASDAQ Composite
Source: Bloomberg.
In turn, market pressures prompted several concerns to pull planned IPO listings in early April, when the sell-off was deepened by an antitrust ruling that declared Microsoft a monopoly. Thereafter, an unexpected increase in consumer price inflation raised the possibility that the Federal Reserve Bank would hike its discount rate further, driving a 9.7% decline in the Nasdaq and a 5.6% fall in the DJIA on April 14, when margin calls reportedly exacerbated the selling.[11] While losses passed to gains – and the Nasdaq advanced 33.8 percent in the ensuing four months – the downward trend reasserted itself in September 2000, when several market leaders, including Intel Corp. and Apple Computer, issued profit warnings that erased more than half their market values.[12] Following restatements from the likes of Lucent Technologies, which told investors it could no longer vouch for its current period projections in November 2000, the Nasdaq was reduced to 2,471, where the index reflected a 51.1 percent decline from the peak nine months prior.[13]
Beginning in 2001, “a second wave of technology disappointments” unfolded in the telecommunications sector, where wireless service providers and equipment vendors drove the next leg downward.[14] As the CEO of Cisco Systems, John Chambers, described the corporate environment in early 2001: “Some people in business were saying it was like they had hit a brick wall, or the switch had been turned off.”[15] Meanwhile, with only 5 percent of the 20.1 million fiber miles laid in active use in 2001, Global Crossing was forced into bankruptcy protection in January 2002.[16] In the interim, the financial carnage extended to Enron in November 2001, when the Houston-based energy trader, in a prelude to its eventual bankruptcy, revealed an earnings overstatement of $600 million.[17] In June 2002, WorldCom then restated its profits by a stunning $3.8 billion.[18] On its heels, in October 2002, the Nasdaq reached its bottom of 1,114, where the index reflected a contraction of 77.9 percent.
Thus, in keeping with prior episodes, the upswell was halted when an infusion of new issues was brought into contact with an exhausted marketplace, where investors had become acutely concerned about the funding needs of internet concerns that, uniquely, went public with the expectation of future losses.[19] But in a new twist, the introduction of lock-up agreements in the wake of the Great Crash (1929) introduced a shadow supply that overwhelmed the marketplace. Indeed, absent the shares held under lock-up agreements in April 2000 that, at $270 billion, amounted to nine times the volume of IPO shares in March 2000, it is not unthinkable that stock prices would have maintained their value. With hedge funds broadly caught flat-footed by the initial downturn, it bears mention that one investor who acted in advance of the downturn was Sir John Templeton, who shorted 84 different Nasdaq stocks on the basis of the expiration of their lock-up agreements out of the belief that insider selling would drive prices lower.[20] On the evidence, one is left to conclude that the proximate trigger was supply.
Charles Lister Smith, PhD
June 19, 2026
[1] Aart Kraay and Jaume Ventura, "The Dot-Com Bubble, the Bush Deficits, and the U.S. Current Account," in G7 Current Account Imbalances: Sustainability and Adjustment, ed. Richard H. Clarida (University of Chicago Press, 2007), 457.
[2] Robert E. Litan, “The Telecommunications Crash: Now What?” Brookings Institute (December 1, 2002, https://www.brookings.edu/articles/the-telecommunications-crash-what-to-do-now/.
[3] John V. Duca and Mark Walker, “Why Has U.S. Stock Ownership Doubled Since the Early 1980s? Equity Participation Over the Past Half-Century,” Federal Reserve Bank of Dallas Working Paper No. 2222 (November 2022), 2. https://doi.org/10.24149/wp2222.
[4] Having accounted for 37 percent between 1995 and 1998, Ritter and Welch (2002, 1800) show technology absorbing 72 percent of IPO proceeds across 1999 and 2000.
[5] “$147 Billion Purchase Underscores Internet Power,” New York Times, January 11, 2000.
[6] This idea is consistent with Keating, Lys, and Magee (2003, 206), who find that the perceptions of investors changed in the Spring of 2000 for reasons other than new reporting.
[7] Floyd Norris, “A Hard Fall as a Highflyer Revises Figures,” New York Times, March 21, 2000, C1.
[8] Jack Willoughby, “Burning Up,” Barron’s (March 20, 2000), 29.
[9] On average, Field and Hanka (2001, 476) find that approximately 63 percent of the post-IPO shares were governed by lock-up agreements that prevented their sale for 180 days.
[10] Ofek, Eli, and Matthew Richardson, "Dotcom Mania: The Rise and Fall of Internet Stock Prices," NBER Working Paper No. 8630 (December 2001), 30.
[11] Thomas S. Mulligan, “Market Meltdown: Dow Suffers Worst-Ever Point Drop of 616,” Los Angeles Times, April 15, 2000, A1.
[12] “Nasdaq Down Sharply in Wake of Intel Warning,” New York Times, September 22, 2000; Andrew Bary, “The Trader: Apple’s Warning Takes Bite out of NASDAQ,” October 2, 2000, MW3-5.
[13] “Lucent Stock Shaken by Downward Revision of 4th Quarter Revenues,” Chicago Tribune, November 22, 2000, 4.
[14] Andrew Barry, “Telecom Woes Send Stocks Through the Wringer,” Barron’s (July 18, 2001), MW3-5.
[15] Paul Abrhams, “IT Sector Faces Long, Bleak Winter,” Financial Times, January 25, 2001; Peter Loftus, “Data Equipment Firms Trim Views as Spending Slims,” New York Times, January 16, 2001, B6.
[16] Nomi Prins, “The Telecoms Disaster,” Left Business Observer, Vol. 101 (July 16, 2002).
[17] Richard Oppel and Andrew Ross Sorkin, “Enron Admits to Overstating Profits by About $600 million,” New York Times, November 9, 2001, C1.
[18] Simon Romero, “Worldcom Says It Hid Expenses, Inflating Cash Flow by $3.8 Billion,” New York Times, June 26, 2002, A1.
[19] To give one such example, Pets.com shut down its operations ten months after its IPO listing in February 2000, incurring cumulative losses of $147 million (Reed Abelson, “Pets.com, Sock Puppet’s Home, Will Close,” New York Times, November 8, 2000, C4).
[20] “Old Dog, New Tricks,” Forbes (May 28, 2001), https://www.forbes.com/forbes/2001/0528/054.html.